
Figure 5. Comparison of foot-flagging response of Staurois parvus between acoustic, visual and multimodal stimuli.
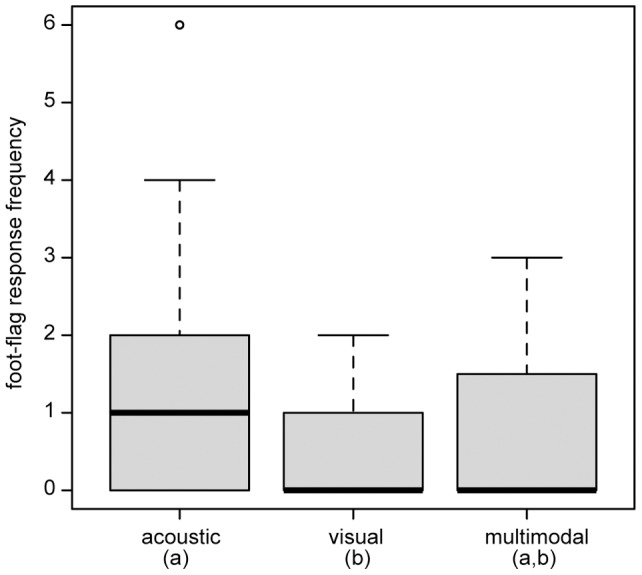
Box plots show the mean individual value with interquartile range, 10th and 90th percentile and minimum and maximum values. Values without the same superscript letter (a, b) differ significantly at P<0.01.