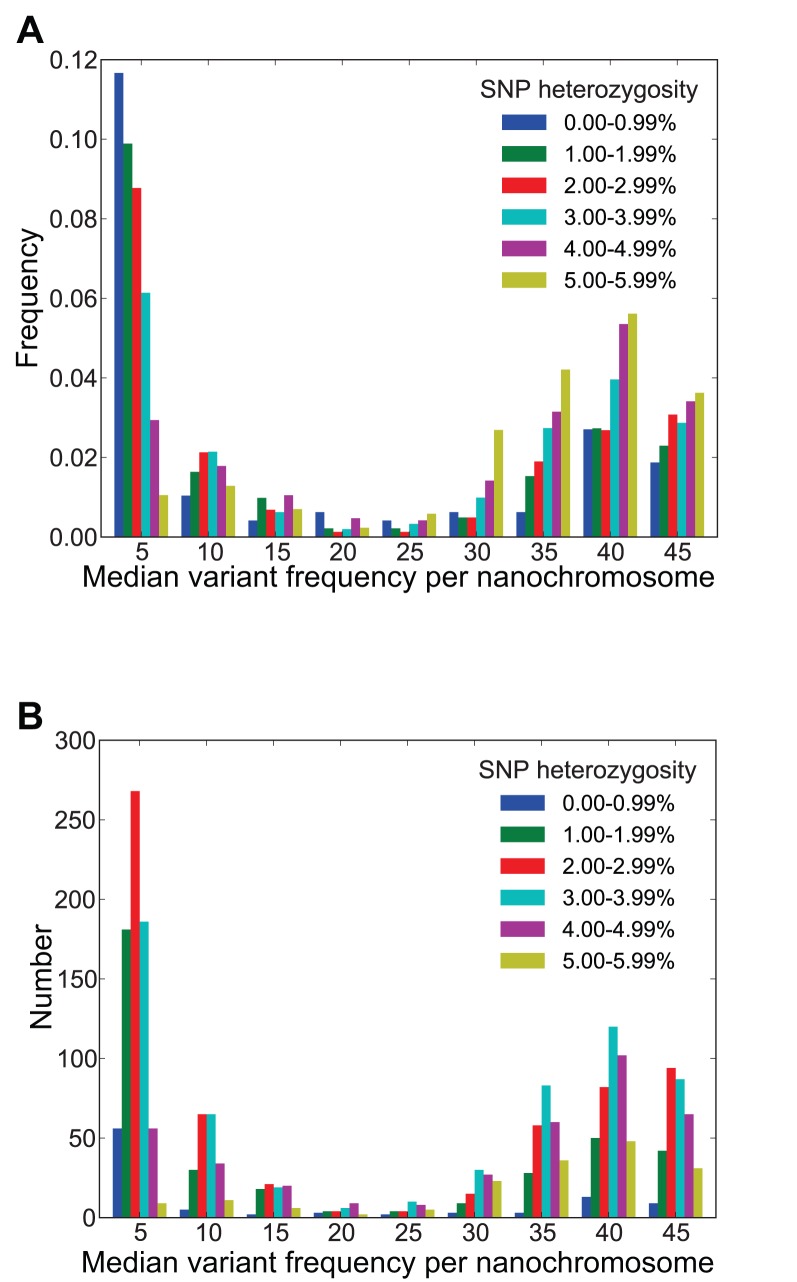
Figure 5. Nanochromosomal variant frequencies.
(A) Normalized to form a probability density (cumulative frequency of 1) and (B) unnormalized median nanochromosomal variant frequencies for six increasing ranges of mean SNP heterozygosity. Variant frequencies were determined for nanochromosomes with no non-self matches to the genome assembly (the same nanochromosomes underlying the SNP heterozygosity histogram for “matchless” nanochromosomes in Figure 4), with variant positions called at the same minimum variant frequency as that used to determine potentially heterozygous sites (5% for sites with ≥20× read coverage). To exclude potentially paralogous mapped reads, we only analyzed nanochromosomes with ≤4 reads mapped to other contigs (using all nanochromosomes does not substantially change the form of the distributions). Variant frequency bins are labeled by their lower bounds. Variant frequencies ≥40 bp from either nanochromosome end were counted to avoid possible incorrect variant calling resulting from telomeric bases that were not masked (due to sequencing errors).

