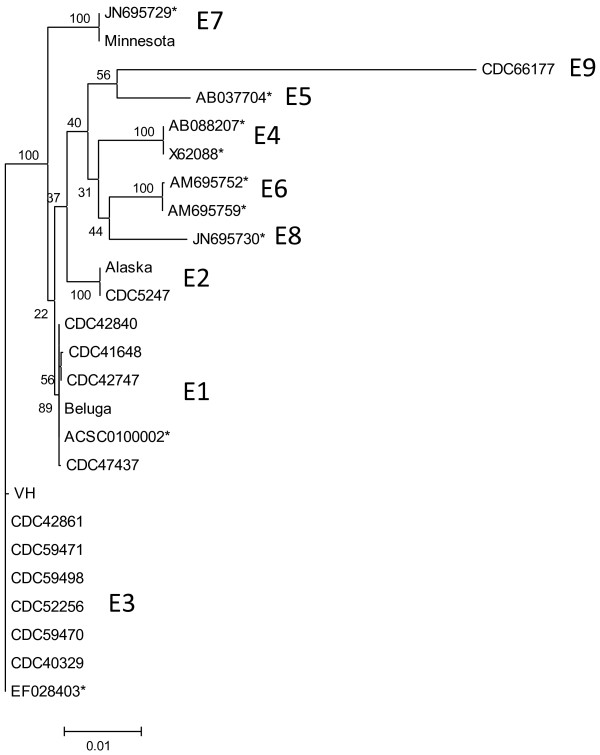
Figure 1.
Dendrogram of bont/E nucleotide sequences. Shown is a neighbor-joining tree of bont/E nucleotide sequences with bootstrap values (based on 100 replications) and genetic distance (bar) shown. BoNT/E subtypes (E1-E9) encoded by clusters of genes are also shown. Accession numbers for bont/E genes not sequenced in this study are indicated with an asterisk.

