
Figure 2.
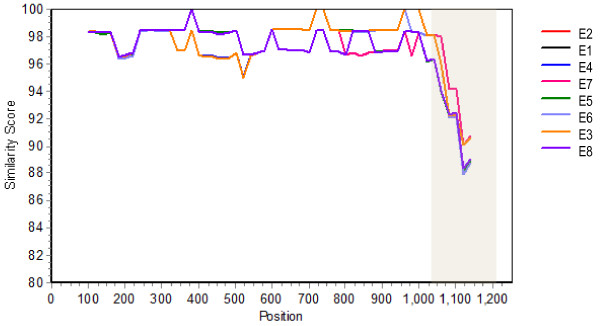
Comparative analysis of representative BoNT/E subtypes. Shown is a similarity plot comparing representative BoNT/E subtype amino acid sequences to BoNT/E9 (from strain CDC66177). The most divergent region of the amino acid sequence is shaded. Sequences from representative strains examined in this study or accession numbers retrieved from Genbank are compared in the plot as follows: E1, Beluga; E2, Alaska; E3, CDC40329; E4, AB088207 E5, AB037704; E6, AM695752; E7, Minnesota; E8, JN695730.