
Figure 7.
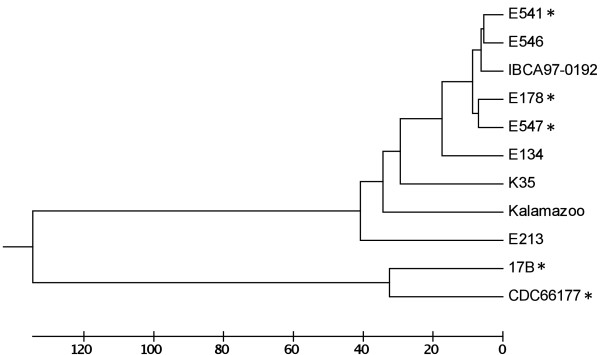
In silico analysis of MLST alleles. Concatemers of MLST alleles for each strain were aligned with CLUSTALW and a UPGMA tree is shown. The scale represents number of differences. Strains isolated from soil and/or sediment sources are indicated with an asterisk. Strain CDC66177 clusters with strain 17B and separately from other type E strains.