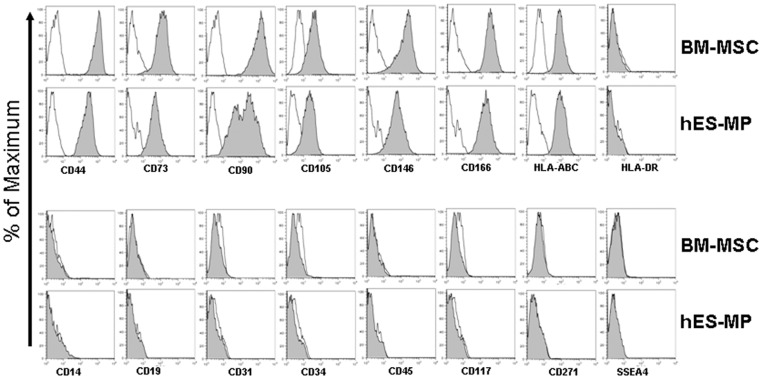
Figure 2. Surface marker expression profiles of hES-MP002.5 cells and BM-MSCs.
hES-MP002.5 cells and BM-MSCs were trypsinized and stained with different combinations of antibodies for flow cytometric analysis. The data are presented as histograms. The percentage of the maximum of the number of cells in each channel is shown on the y-axis. Samples are presented in the shaded plots, corresponding isotype controls are shown as open lines. hES-MP002.5 cells and BM-MSCs showed comparable surface marker expression profiles, except for differences in CD90 expression. Representative histograms of one of three independent experiments are shown.

