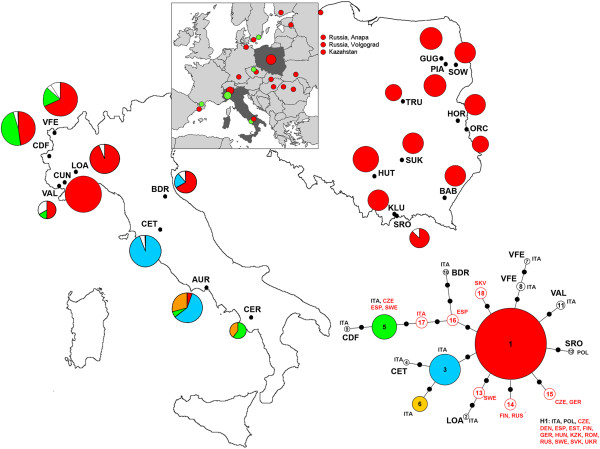
Figure 1.
Distribution of COI haplotypes among populations of Maculinea arion sampled in Italy and Poland. The data are supplemented by haplotypes detected by Ugelvig [28] and Als et al. [58] and the maximum parsimony networks for all haplotypes. Unique COI haplotypes (present in individual populations only) are left uncoloured. The sizes of the circles are directly proportional to the number of individuals analysed. For full site names and other details see Table 1.

