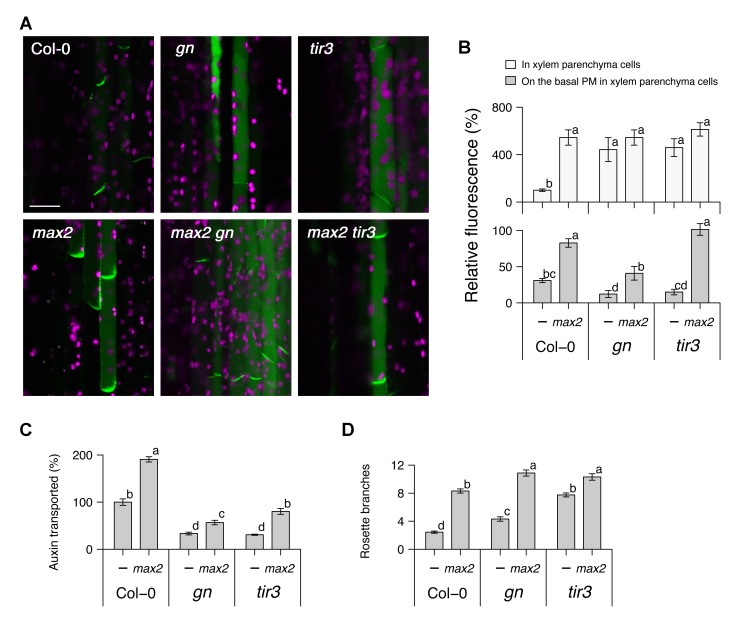
Figure 1. Genetic interactions between max2, gn, and tir3.
(A) Micrographs and (B) their quantitative analysis of longitudinal sections from inflorescence stems of 6-wk-old soil-grown Arabidopsis plants harbouring PIN1:PIN1–GFP in either the wild-type, gn, or tir3 genetic background, with or without max2. (C) Stem polar auxin transport levels and (D) the number of rosette branches in plants of the above genotypes grown on soil. In (A), green shows the PIN1–GFP signal, predominantly localised to xylem parenchyma cells, and magenta shows autofluorescence of chloroplasts; scale bar: 20 µm. In (B), the whole-cell signal (light grey) and signal localised to the basal PM (dark grey) are shown as means ± s.e.m. of nine xylem parenchyma cells in three to four plants as a percentage to the whole-cell signal of the wild-type; samples were compared by Tukey's test. In (C), stem segments were excised from 6-wk-old plants and incubated in liquid medium containing 1 µM [14C] IAA, and the amount of radiolabelled auxin transported over a period of 6 h was measured and converted to the percentage of wild-type; means ± s.e.m. of 16 segments are shown; samples were compared by Tukey's test. (D) shows means ± s.e.m. of 16 8-wk-old plants; samples were compared by Steel–Dwass test. Results presented are typical of at least two independent experiments.

