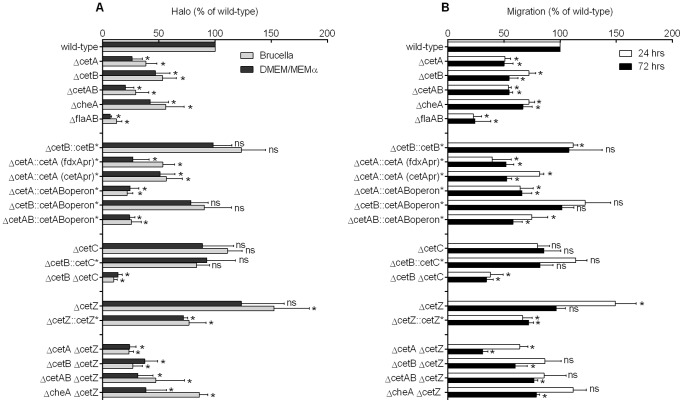
Figure 3. CetABC and CetZ play opposing roles in energy taxis.
A) Results from swarming assays in Brucella (light grey) and DMEM/MEMα media (dark grey). B) Initial 24 hour (white) and final (black) 72 hour time points from the tube assay. Strain designations are shown on the Y-axis. All data are expressed as a percentage of the wild-type and error bars show the standard deviation from at least three biological replicates. Asterisks denote statistically significant results compared to the wild-type (one-sample t-test, p<0.05).

