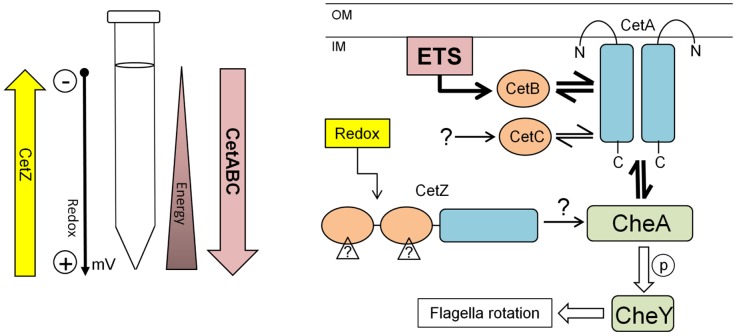
Figure 4. Model of how the combined activity of the CetABC and CetZ systems control energy taxis in C. jejuni.
A) Diagram showing our assumptions about the tube taxis assay (right), schematically displaying a hypothesis on role and sensing by the CetZ and CetABC systems. B) Model displaying possible signal transduction by the CetABC and CetZ system (left, adapted from [19]) and their interaction with the chemotaxis pathway via the CheA protein. The dominant CetABC pathway is shown by bold arrows (see discussion for more information). ETS, electron transport chain; OM, outer membrane; IM, inner membrane.

