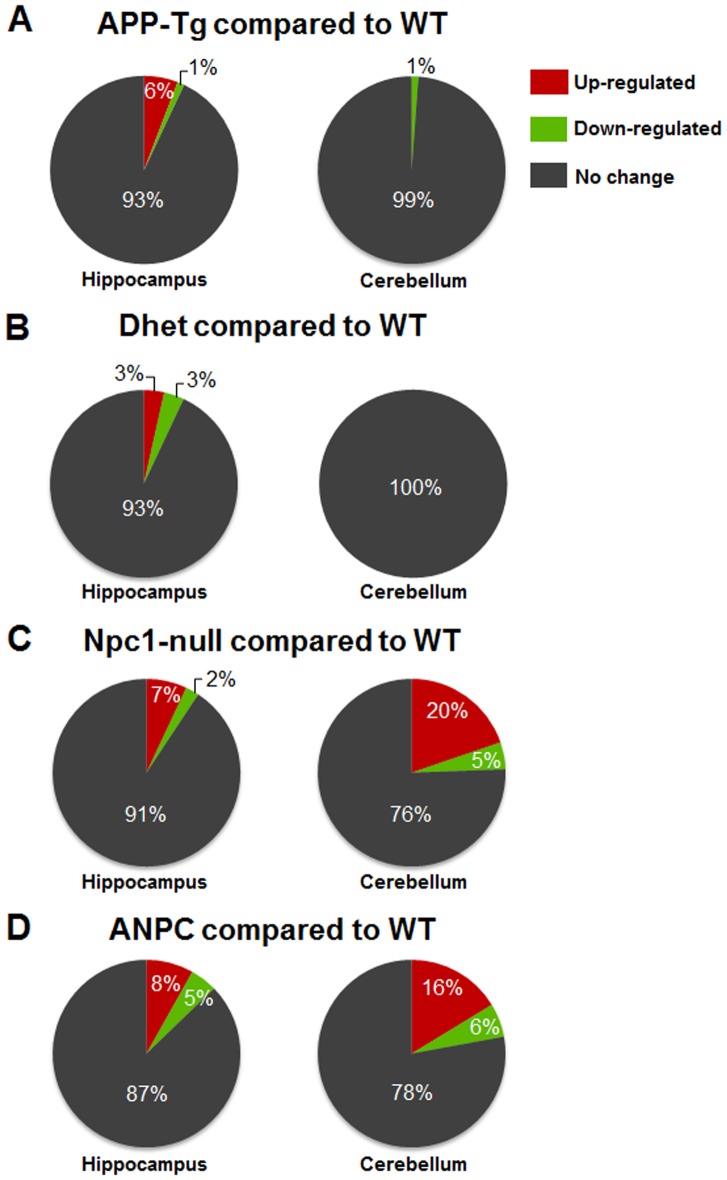
Figure 3. Differentially expressed genes in different mice lines compared to WT mice.
Pie-charts showing percentage of up- and down-regulated genes in the hippocampus and cerebellum of 7-week-old APP-Tg (A), Dhet (B), Npc1-null (C) and ANPC (D) mice each compared to WT littermates. Gene expression levels are colored red for significant up-regulation, green for significant down-regulations and grey for no alteration compared to WT mice. As evident from the pie-charts, several genes are differentially expressed in the hippocampus and cerebellum of Npc1-null and ANPC mice, whereas the changes in APP-Tg and Dhet mice are limited to only a few genes.

