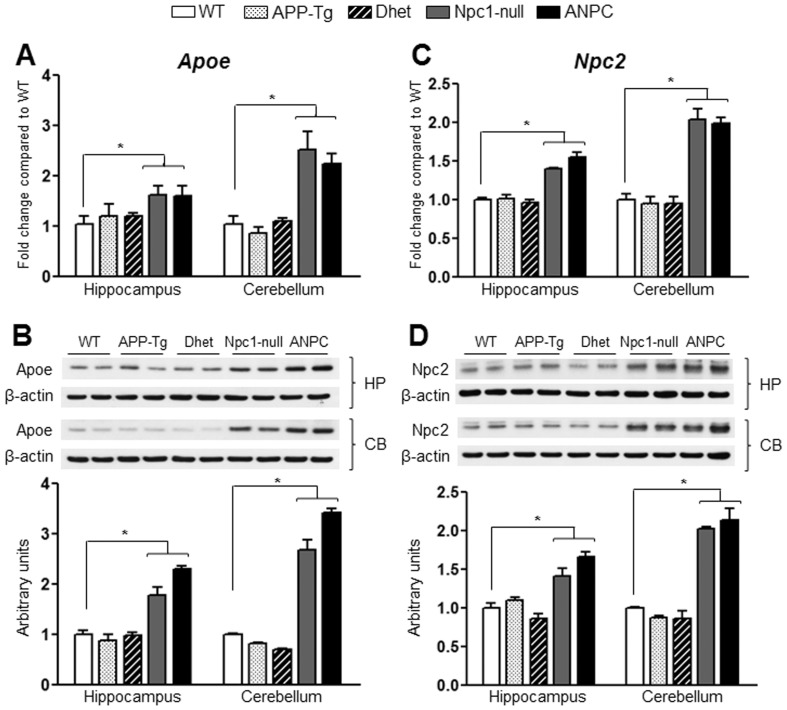
Figure 4. Transcript and protein expression levels of Apoe and Npc2 in the hippocampus and cerebellum of five lines of mice.
A and C, Histograms showing increased mRNA levels for Apoe (A) and Npc2 (C) in the hippocampus and cerebellum of Npc1-null and ANPC mice compared with WT mice as obtained using customized real-time RT-PCR array. B and D, Immunoblots and respective histograms validating increased levels of Apoe (B) and Npc2 (D) in the hippocampus and cerebellum of Npc1-null and ANPC mice compared with age-matched WT mice. The protein levels of Apoe and Npc2 were normalized to the β-actin and the values (n = 4 animals per genotype) are expressed as means ± SEM. *, p<0.05.

