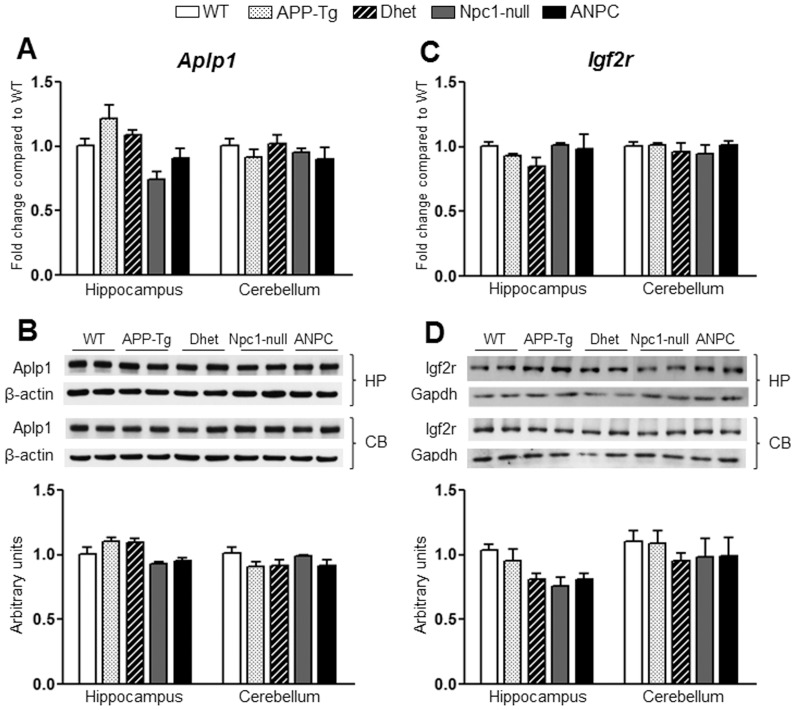
Figure 8. Transcript and protein expression levels of Aplp1 and Igf2r in the hippocampus and cerebellum of five lines of mice.
A and C, Histograms showing no significant alteration in Aplp1 (A) and Igf2r (C) mRNA levels in the hippocampus and cerebellum of APP-Tg, Dhet, Npc1-null and ANPC mice compared with WT mice as obtained using customized real-time RT-PCR array. B and D, Immunoblots and respective histograms showing no significant alteration in Aplp1 (B) and Igf2r (D) protein levels in the hippocampus or cerebellum of the different genotype combinations compared with WT mice consistent with the transcript levels. The protein levels of Aplp1 and Igf2r were normalized to the β-actin and GAPDH respectively, and the values (n = 4 animals per genotype) are expressed as means ± SEM. *, p<0.05.

