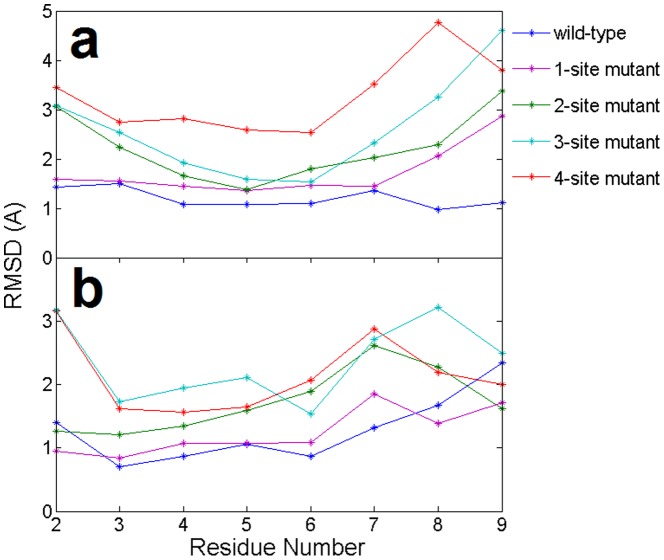
Figure 3. Comparison of the average RMSDs (per residue) in the (a) target mRNA and (b) guide DNA from the starting native structures of the wild-type and 4 mutants in the 11-bp nucleic acid heteroduplex.
The results are obtained from 1 atm, 310 K NPT simulations (100∼120 ns). The X-axis indicates nucleotide position from the 5′ end of the guide DNA.

