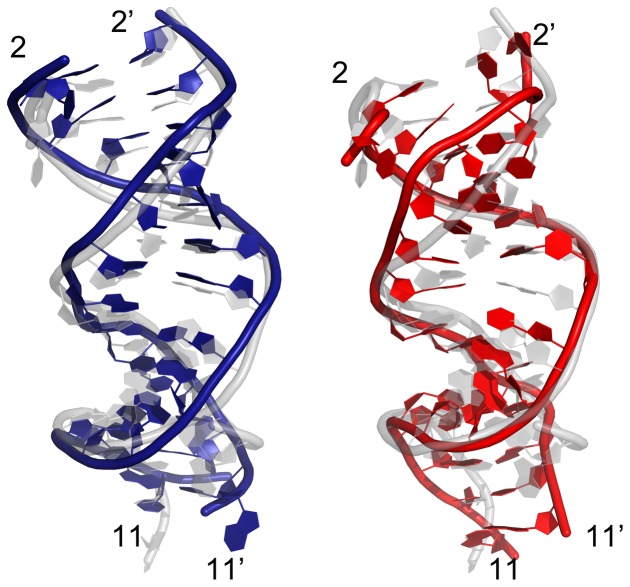
Figure 10. Structural comparison and distortion.
Superposition of the final conformation (colored in blue for the wild-type on the left, and red for the 4-position mismatch mutant on the right) and the starting native structure (colored in light grey) for both the wild-type and the 4-site mismatch mutant using the longer 15-bp guide DNA/mRNA heteroduplex after ∼100 ns of MD simulation. The backbone is represented as a tube and the rest are shown as plates. The numbers with prime (′) indicate that the nucleic acid belongs to the target strand. Larger distortion in the seed region (position 2 to 8) can be clearly seen on the 4-site mismatch mutant.

