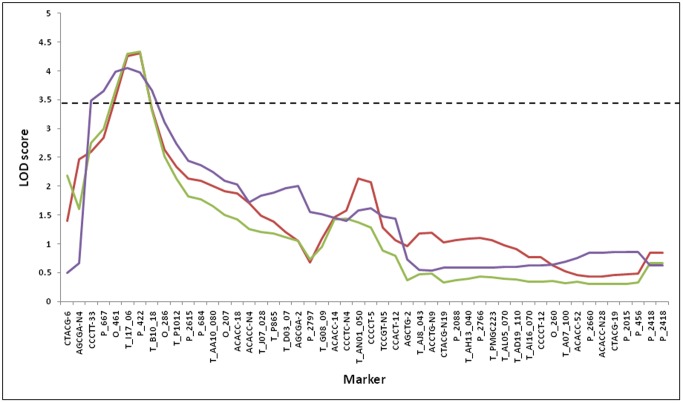
Figure 1. LOD traces for QTL BM-2 on LG II based on 4-year height (red) and 4-year diameter (green) measured in Clatskanie and 4-year height measured in Boardman (purple).
Broken horizontal line represents linkage groupwise LOD significance threshold calculated based on 1,000 permutations at the 0.05 significance level.

