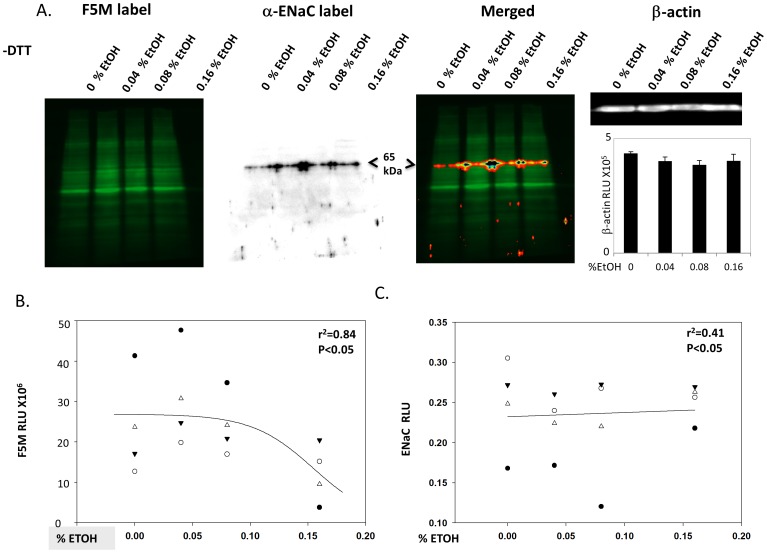
Figure 4. A) Acute EtOH treatment modifies Cys thiols on α-ENaC.
Primary alveolar T2 epithelial cells were treated with 0, 0.4, 0.8, or 0.16% EtOH prior to F5M labeling of cells. Left panel: F5M signal intensity of EtOH treated cells; excitation emission 480/535 nm; non-reducing gel (−DTT). Middle panels: bioluminescent detection of α-ENaC subunit in F5M labeled cells using the same nitrocellulose membrane shown in left panel and anti-C 20-α-ENaC antibody (Santa Cruz) and alkaline phosphatase (AP) conjugated secondary antibody merged with F5M signal, as indicated. Right panel: β-actin blot and quantification shows equal amounts of protein loaded. B) Linear regression graph where F5M RLU = dependent variable and %EtOH treatment = independent variable. C) Densimetric analysis of F5M labeled primary alveolar T2 cells immunoblotted for α-ENaC.

