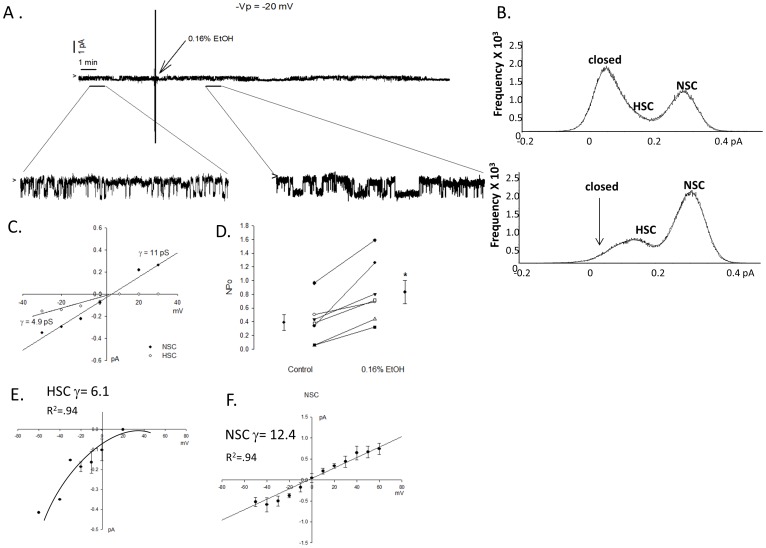
Figure 6. Acute 0.16% ETOH treatment increases sodium channel activity.
A) Continuous single channel recording obtained from primary isolated rat T2 cell treated with 0.16% EtOH after 5 min control recording period as indicated with enlarged portions of the trace. Arrow indicates closed state of channels, with downward deflections from arrow indicating Na movement into the cell. B) Point amplitude histograms show frequency of NSC and HSC activity in representative recording before and after EtOH treatment. C) Conductances (γ) of representative HSC (4.9pS) and NSC (11pS) channels shown in representative trace. D) Number and open probability (NPo) of ENaC reported before and after 0.16% EtOH treatment in 7 cell-attached recording; p<0.05. E-F) I/V curve of all cell recordings with average HSC γ = 6.1 and NSC γ = 22.2.

