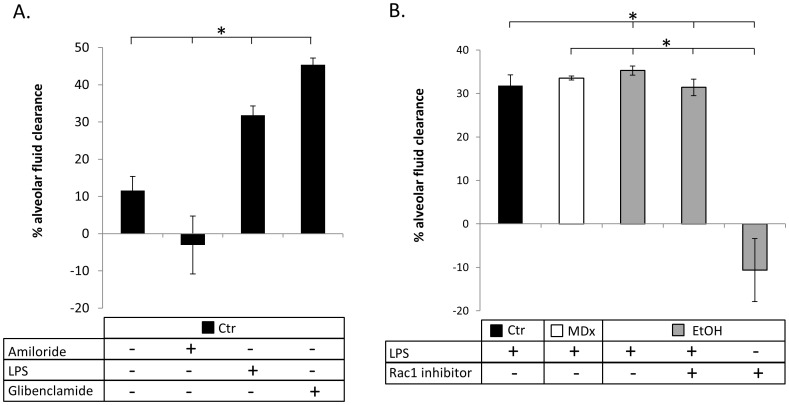
Figure 10. Changes in albumin protein concentration confirm fluorometric data obtained from live animals.
A) C57Bl6 mice challenged by IT instillation of saline, 1 mM amiloride, 1 mg/mL LPS, or 1 mM glibenclamide as indicated. n = 2 for each observation with * = p<0.05. B) C57Bl6 mice (black bars), maltodextrin-control fed mice (white bars); or chronic ethanol mice (grey bars) were treated with 1 mg/mL LPS in the presence or absence of 1 µM NSC23766. n = 3 independent observations with * = p<0.05. In 10A–B, the percent changes in albumin protein concentration were obtained 90 min following instillation; percentages greater than average control values indicate enhanced rates of fluid clearance, whereas negative percent changes are indicative of alveolar flooding.

