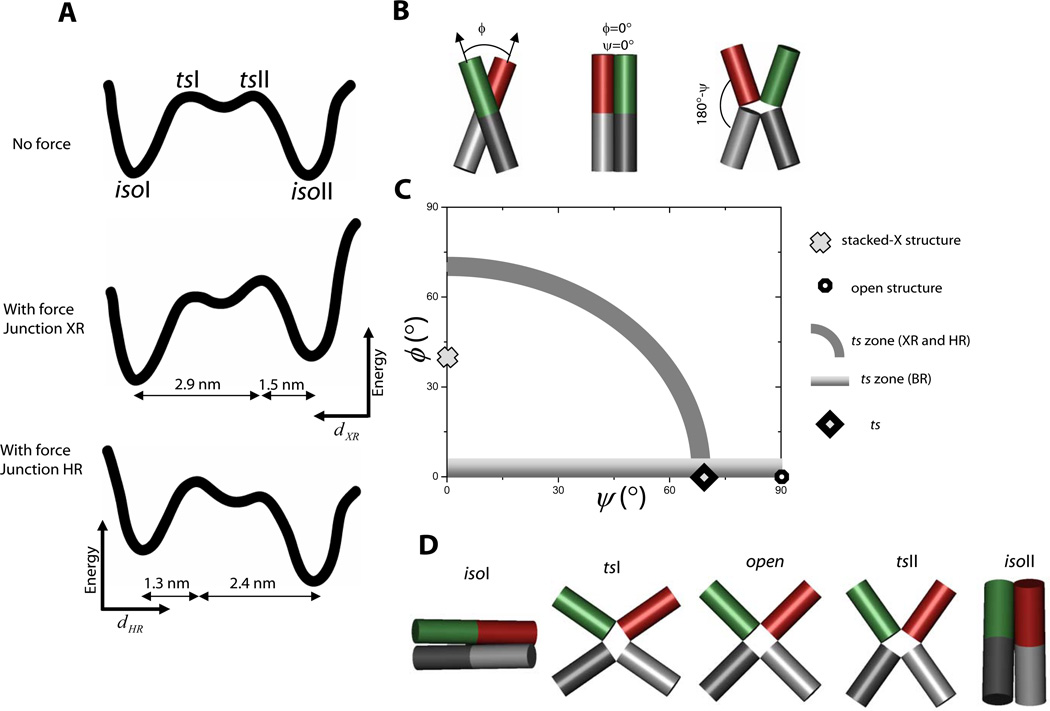
Figure 3.
Mapping the reaction landscape and determining the transition state structure. (A) A proposed reaction landscape with two distinct transition states with nearly identical energies (top). In junction XRthe applied force would tilt the energy landscape toward isoI so that the transition state, tsII, nearer to isoII would become the state of highest energy along the entire coordinate (middle). The reaction coordinate here is the distance between the ends of X and R arms, dXRwhich increases to the left as shown. Similarly, in junction XRthe transition state, tsI, nearer to isoI would become the single transition state upon application of force. The reaction coordinate here is the distance between the ends of H and R arms, dHRwhich increases to the right. (B) Two angular coordinates ϕ and ψ define the global conformation of the HJ. (C) Two-dimensional conformational space of HJ conformations. The stacked-X structure and open structure are marked. The gray arc represents a zone that satisfies experimental constraints derived from XR and HR data, and the gradient zone is derived from BR data. The consensus location of the transition state is marked with a diamond. (D) Global structures of isoI, isoII and two transition states, tsI and tsII, plus an open structure.

