
Figure 3.
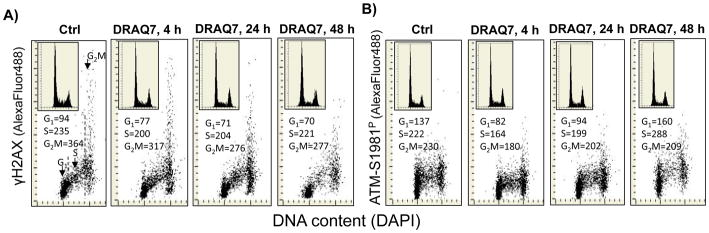
Effects of prolonged cell culture with DRAQ7 on DNA damage responses. A) Expression of γH2AX of A549 cells, untreated (Ctrl) and exposed to 3 μM DRAQ in cultures for 4, 24 and 48 h. The mean values of γH2AX expression estimated for subpopulations of cells in G1, S and G2M phases of the cell cycle are shown in the respective panels. The insets present DNA content frequency histograms from the respective cultures. B) Expression of ATM-S1981P of A549 cells, untreated (Ctrl) and exposed to 3 μM DRAQ7 in cultures for 4, 24 and 48 h. The mean values of ATM-S1981P expression estimated for subpopulations of cells in G1, S and G2M phases of the cell cycle are shown in the respective panels. The insets present DNA content frequency histograms from the respective cultures.