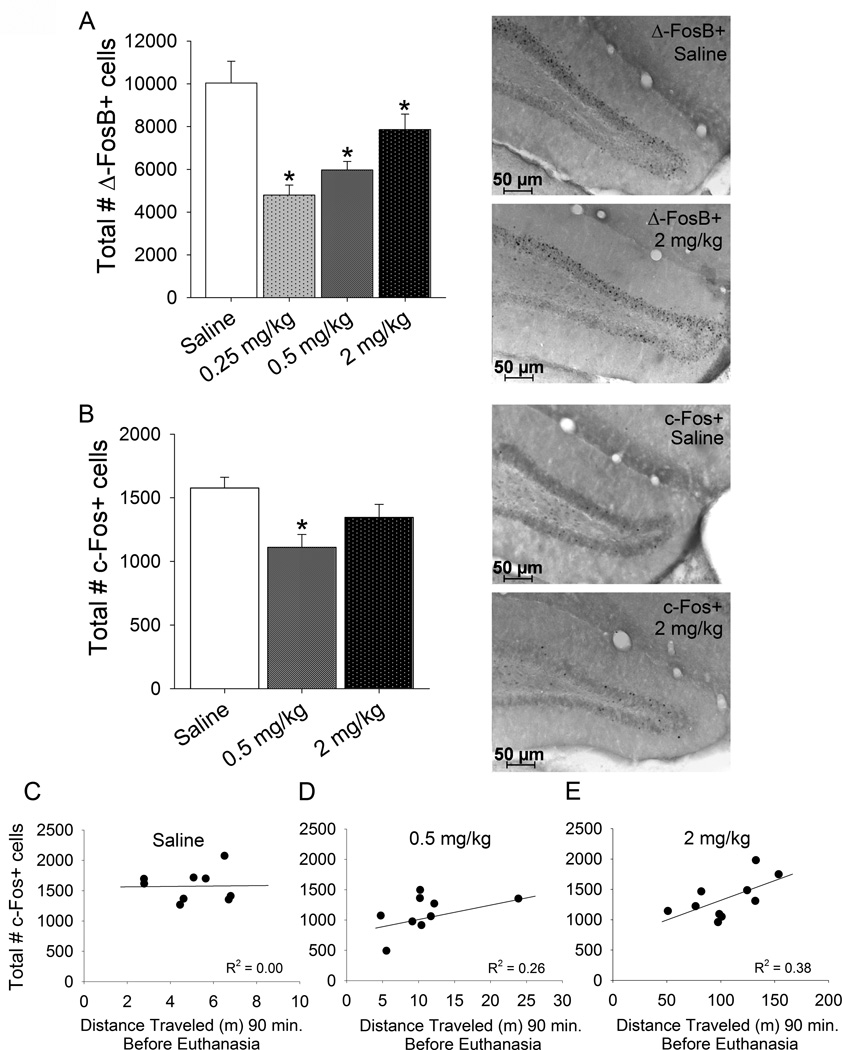
Figure 4. Neuronal activation markers.
A) Total number of ΔFosB positive cells in the granule cell layer of the dentate gyrus in animals from experiment 1. Averages and standard errors shown for each treatment group: saline, 0.25, 0.5, and 2 mg/kg d-amphetamine (n=8 per group). *indicates significantly different from saline. Photographs to the right of the graph show representative sections through the dentate gyrus immunohistochemically stained for ΔFosB from a saline-treated animal (top) and an animal treated with 2 mg/kg d-amphetamine (bottom). B) Total number of c-Fos positive cells in the granule layer of the dentate gyrus in animals from experiment 2. Averages and standard errors shown for each treatment group: saline (n=9), 0.5 mg/kg (n=9), and 2 mg/kg (n=10) d-amphetamine. *indicates significantly different from saline. Photographs to the right show representative sections through the dentate gyrus immunohistochemically stained for c-Fos from a saline treated animal (top) and an animal treated with 2 mg/kg d-amphetamine (bottom) C) Total number of c-Fos positive cells plotted against the distance traveled (m) 90 min preceding euthanasia for the saline treatment group. D) same as C except for the 0.5 mg/kg d-amphetamine group. E) same as C except for the 2 mg/kg d-amphetamine group. Simple linear regression lines and R2 values are shown in each plot.

