Figure 2.

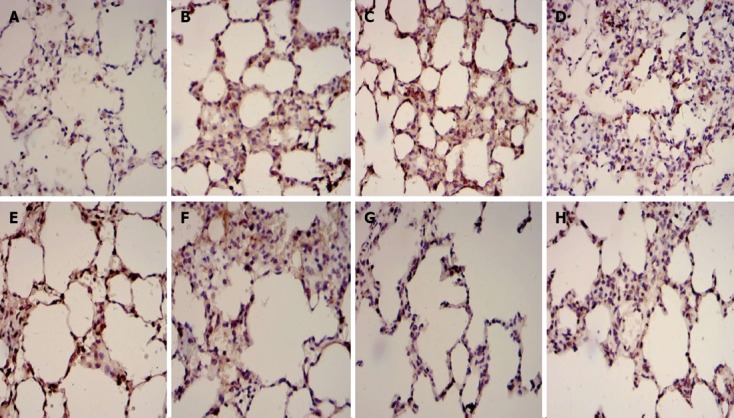
Immunohistochemical examples for Fas and Bcl2 in dorsal lobe of right lung tissue. A: Fas in control group; B: Fas in septic shock group; C: Fas in early fluid resuscitation-treated group; D: Fas in early fluid resuscitation + 2% hydrogen inhalation-treated group; E: Bcl2 in control group; F: Bcl2 in septic shock group; G: Bcl2 in early fluid resuscitation-treated group; H: Bcl2 in early fluid resuscitation + 2% hydrogen inhalation-treated group. Examples were examined under a light microscope equipped with an image analysis system. Yellow or brownish-yellow staining represents positive staining. The expression of Fas proteins was up-regulated, while the expression of Bcl2 proteins was down-regulated in Group B compared with Group A. In Group C, however, the expression of Fas proteins was down-regulated, and the expression of Bcl2 proteins was up-regulated compared with Group B. In addition, the lower expression of Fas proteins and the higher expression of Bcl2 proteins were observed in Group D compared with Group C.
