Figure 3.
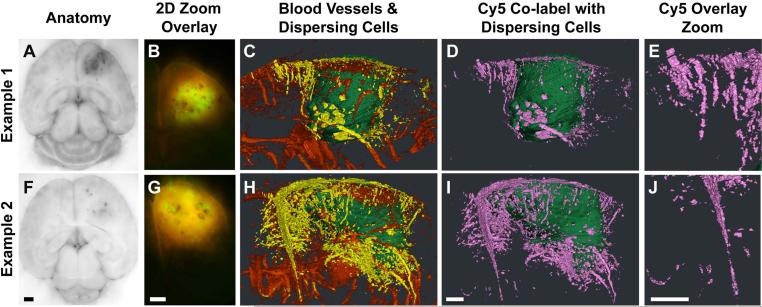
3-D views of dispersed cells from CNS-1 intracranial tumors labeled by the PTPμ probe. Unfixed mouse brains containing xenografts of GFP-expressing CNS-1 cells were cryo-imaged and reconstructed in 3 dimensions following in vivo labeling with the PTPμ probe. Two-dimensional block face images are shown for brightfield (A,F), and 2-D block face zoomed overlay of GFP (tumor) and Cy5 fluorescence (PTPμ probe; B,G) for two brain tumors. Three-dimensional reconstructions of the same tumor specimens showing the main tumor mass (pseudo-colored green), dispersed tumor cells (pseudo-colored yellow), and vasculature (pseudo-colored red) illustrate that the dispersing cells often migrate on blood vessels (C,H). The total dispersing cell population is extensively co-labeled with the PTPμ probe (D,I), as shown pseudo-colored pink. Magnified views from (D,I) illustrate that PTPμ co-labeled cells are detected several millimeters from the main tumor (E,J). Scale bar in F represents 1 mm for panels (A,F) and scale bar in G represents 1 mm for panels (B,G). Scale bar in I represents 500 μm for panels (C–D, H–I) and the scale bar in J represents 500 μm for panels (E, J).
Burden-Gulley, et al.

