Figure 5.
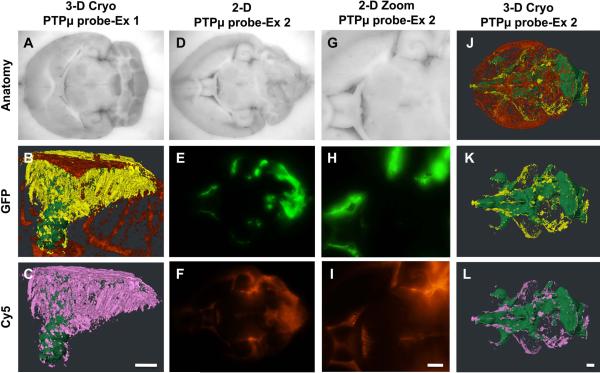
Dispersing cells from LN-229 intracranial tumors are specifically labeled by the PTPμ probe. Unfixed mouse brains containing xenografts of GFP-expressing LN-229 cells were cryo-imaged and reconstructed in 3 dimensions following in vivo labeling with the PTPμ probe. Three-dimensional reconstruction of an LN229 tumor (A) shows the main tumor mass (pseudo-colored green), dispersed tumor cells (pseudo-colored yellow) and vasculature (pseudo-colored red) (B). PTPμ probe co-labeling of dispersing cells (pseudo-colored pink) was observed at great distances from the main tumor (C). A second tumor example where the LN229 tumor cells spread through the ventricles of the brain is shown (D–L). Two-dimensional block face images are shown for brightfield (D,G), GFP fluorescence (tumor; E,H) and Cy5 fluorescence (PTPμ probe; F,I). Comparison of GFP (E) and Cy5 (F) fluorescence in zoomed images (H,I) demonstrates extensive overlap in signal in this specimen. Three-dimensional reconstruction of the same tumor specimen is shown (J–L). In addition to the main tumor, the total dispersing cell population is extensively co-labeled with the PTPμ probe as shown pseudo-colored pink (L). Scale bar in (L) represents 500 μm for panels (A, D–F, J–L). Scale bar in (C) represents 500 μm for panels (B,C). Scale bar in (I) represents 500 μm for panels (G–I).
Burden-Gulley, et al.

