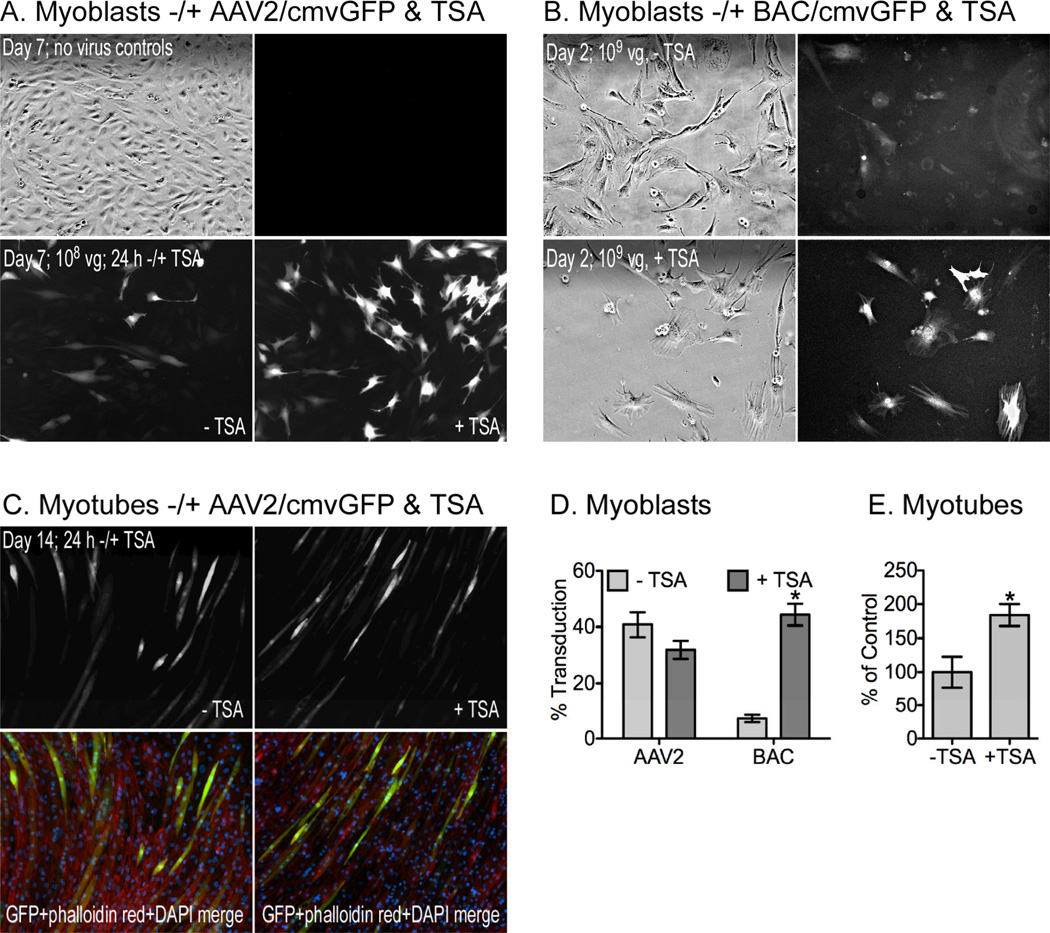
Figure 3. TSA effects on AAV2 and baculovirus (BAC) transduction.
Proliferating C2C12 myoblasts were plated at low densities (260 cells/cm2) and incubated with (A) AAV2/cmvGFP or (B) BAC/cmvGFP for 7 or 2 days, respectively. Cells were treated −/+ 1 µM TSA during the final 24 h before imaging at 100×. (C) The C2C12 cells not treated with TSA were subsequently differentiated in low serum for an additional 7 days and as before, were treated −/+ TSA during the final 24 h. (D,E) The number of total and fluorescent myoblasts were counted and the average field fluorescent intensity of the myotubes was quantified with Image J as described in the Materials and Methods (mean +/− SEM; asterisks = significant difference, −/+ TSA vector groups analyzed independently; p≤0.05).

