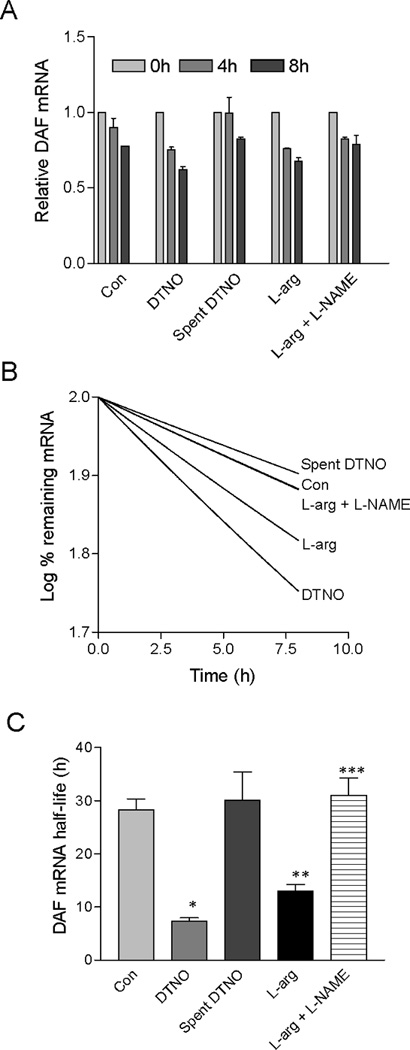
FIGURE 4.

DAF mRNA half-life is altered by NO. (A) Ishikawa cells were treated with Actinomycin D (1 µg/ml) for 4 h and then exposed to DTNO (1 mM) or spent DTNO (1 mM) or the substrate for NOS enzyme L-arginine (0.3 mM) or L-arginine combined with NOS inhibitor L-NAME (3 mM) for different time periods. The fold changes in the DAF mRNA were measured for each treatment by RT-qPCR. Experiment was performed three times and one set of data is presented. Error bars indicate S. E. of triplicate samples. (B) Log % remaining DAF mRNA versus time was plotted for control and treated cells. Decay constants were calculated from non-linear single exponential decay curves. (C) The mRNA half-life was calculated using the formula t1/2 = ln2/kdecay, where t1/2 is DAF mRNA half life and kdecay is decay constant. Error bars indicate S. E. of three experiments. (*, **, p < 0.05 versus control; ***, p < 0.05 versus L-arg).
