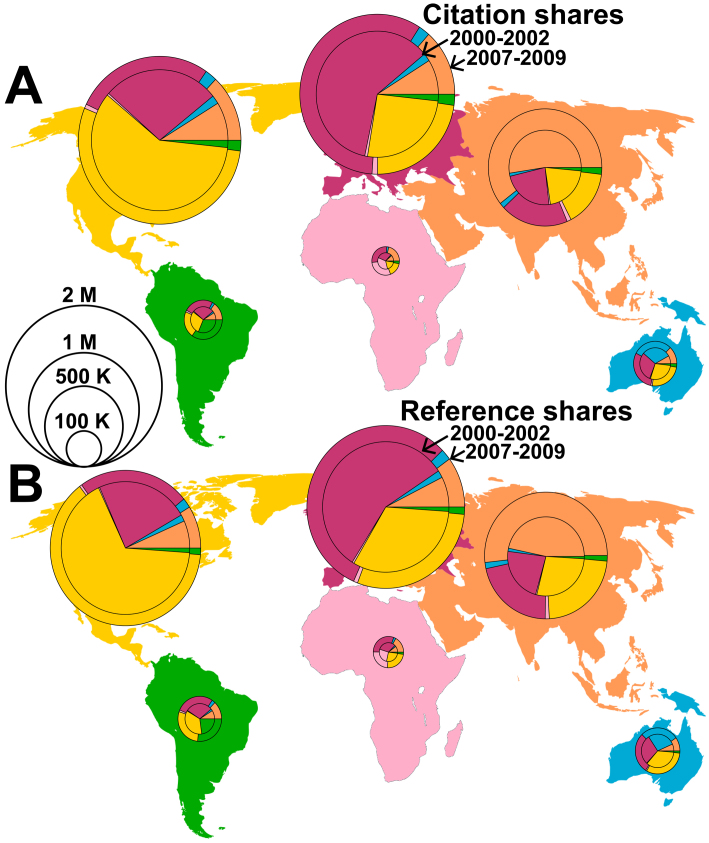
Figure 1. World map of knowledge production and consumption in 6 major geographic areas of the world (North America, South America, Europe, Asia, Australia and Africa).
Circle size reflects the number of papers Pi produced by the corresponding entities i. The inner circle is for 2000–2002, the outer one for 2007–2009. The size of the pies represents (A) the relative proportion of citations Ci that the entities earned in the 6 geographic areas, (B) similar for references Ri recorded in the Thomson Reuters Web of Science database. The number of papers and citations have increased over time in all geographic areas, but their shares of references and citations have changed. For example, Asia reaches higher shares recently, characterizing it as an emergent scientific power, which has become almost comparable to North America or Europe. Note that, in the three leading knowledge producing areas, the majority of references cites papers published in the same geographic area, i.e., proximity matters.

