


Figure 4. Reaction Times and Spatial Accuracy.
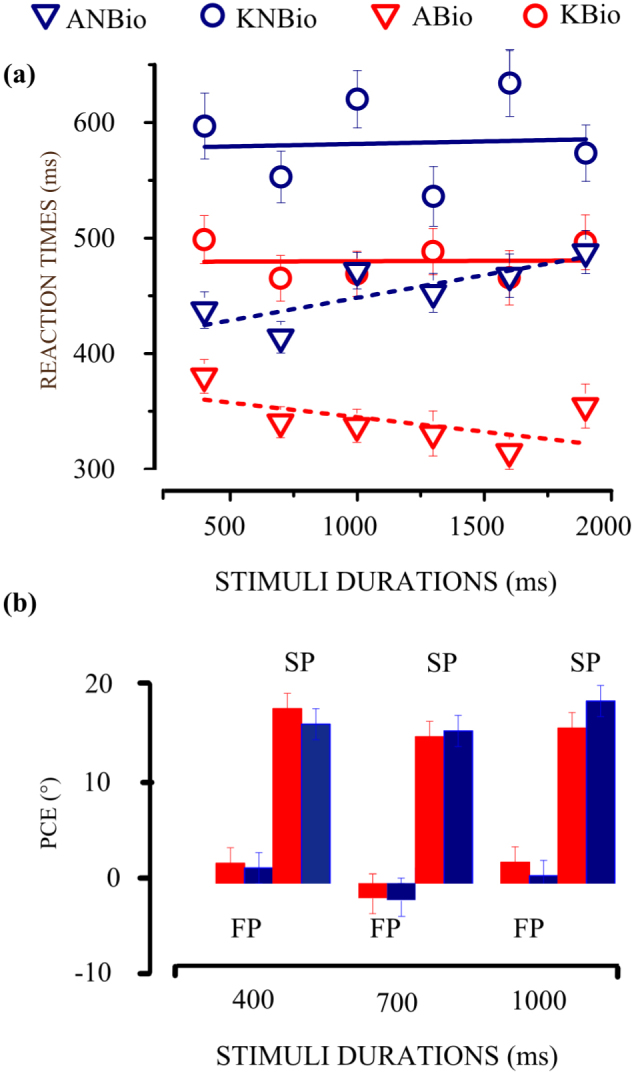
The colors code the Stimulus (red - Bio kinematics, blue - NBio constant motion), whereas the shape codes the Task (circle-key K, triangle–arm A). (a) Reaction times as a function of the -stimuli durations- Time. (b) PCE (±standard error) as a function of the stimuli durations. Positive values indicate errors in the direction of the stimuli motion. Each histogram is respectively named FP or SP in relation to the final or the starting position of the evaluation.