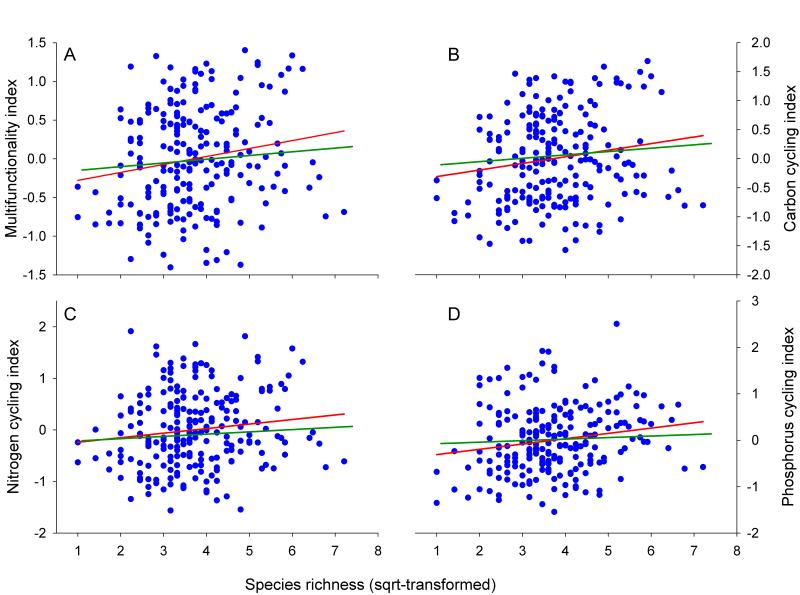
Figure 1.
Relationship between perennial plant species richness and ecosystem multifunctionality (A) measured in a global survey of drylands. Similar relationships for carbon (B), nitrogen (C) and phosphorus (D) cycling are shown. Red and green lines are the fitted lines from ordinary least squares (OLS) and spatial autoregressive (SAR) regressions, respectively. Results of regressions are as follows: A) OLS, R2 = 0.030, P = 0.009; SAR, R2 = 0.022, P = 0.027; B) OLS, R2 = 0.029, P = 0.011; SAR, R2 = 0.022, P = 0.027; C) OLS, R2 = 0.018, P = 0.044; SAR, R2 = 0.014, P = 0.082; and D) OLS, R2 = 0.032, P = 0.008; SAR, R2 = 0.016, P = 0.061.

