
Table 1.
Best-fitting regression models of ecosystem multifunctionality. Each column represents a different predictor variable (red = perennial plant species richness; green = abiotic variables, blue = climatic variables, gold = geographic variables). Of all 255 possible models, the best eight models are presented, ranked according to the second-order Akaike information criterion (AICc). AICc measures the relative goodness of fit of a given model; the lower its value, the more likely this model is correct. Unshaded cells indicate variables that were not included in a particular model. The first and third models of the table are the best and most parsimonious models, respectively; the same models without species richness had R2 = 0.539, AICc = 293.236, Δ AICc = 10.486, and R2 = 0.515, AICc = 300.078, ΔAICc = 17.328, respectively.
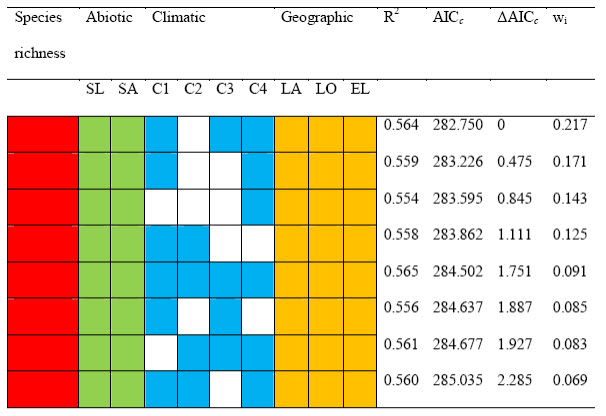
R2 = percent variation in multifunctionality explained by the model, ΔAICc = difference between the AICc of each model and that of the best model, wi = Akaike weights, C1, C2, C3, C4 = first, second, third and fourth components of a principal component analysis conducted with climatic variables, SA = sand content, SL = slope angle (sqrt-transformed), EL = elevation (sqrt-transformed), LA =latitude, and LO = longitude.