Figure 3.
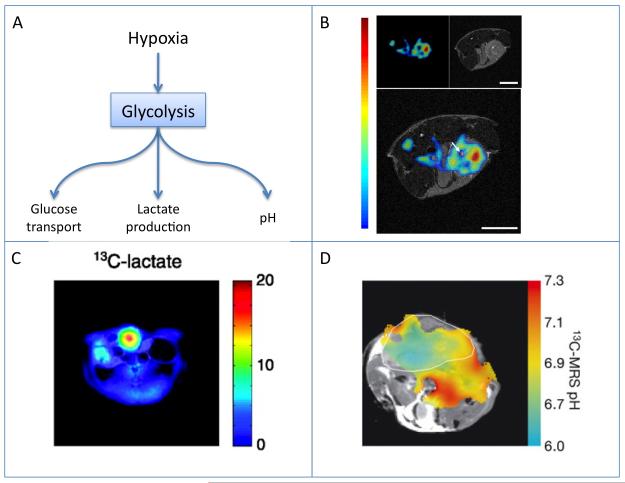
Hypoxia, glycolysis, and tumor acidosis.
A) Scheme showing the role of hypoxia in mediating tumor glycolytic activity, including increased glucose uptake, lactate production and acidosis.
B) Mapping glucose uptake by simultaneous in vivo PET and MR imaging. Mouse FDG tumor imaging: (Upper Left) PET image, (Upper Right) MR image, and (Lower) fused PET and MR image. One transaxial image slice is shown. Reproduced from (65).
C) 13C MRI mapping of lactate production from hyperpolarized pyruvate. Color scale maps the intensity of lactate on the anatomical 1H image. The P22 tumor tissue is indicated by the highest signal for lactate. Reproduced from (78).
D) 13C MRI pH mapping of a mouse with a subcutaneously implanted EL4 tumour (outlined in white). The pH map was calculated from the ratio of the H13CO3–and 13CO2 in 13C chemical shift images acquired after intravenous injection of hyperpolarized H13CO3. Reproduced from (80).

