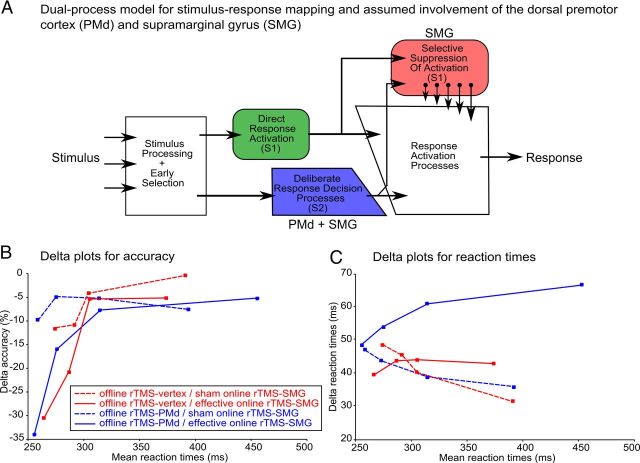
Figure 5.
A. Schematic illustration of the dual-process model for stimulus-response mapping in trials with conflicting information. The increasing size of the arrows for selective inhibition represent the operation dynamics for this process (i.e., suppression is not initiated immediately after signal onset but takes time to build up). S1, invalid precue; S2, target stimulus. B, C, Delta plots for the four combinations of off-line and on-line rTMS. The delta plots illustrate the interference effect of invalidly precued trials as a function of response speed. B, Relative decrease in accuracy (%). C, Relative increase in RTs (milliseconds) for invalidly compared with validly precued trials. The four data points of each curve represent the mean data for equally sized RT quartiles (0–25%, 26–50%, 51–75%, and 76–100%).

