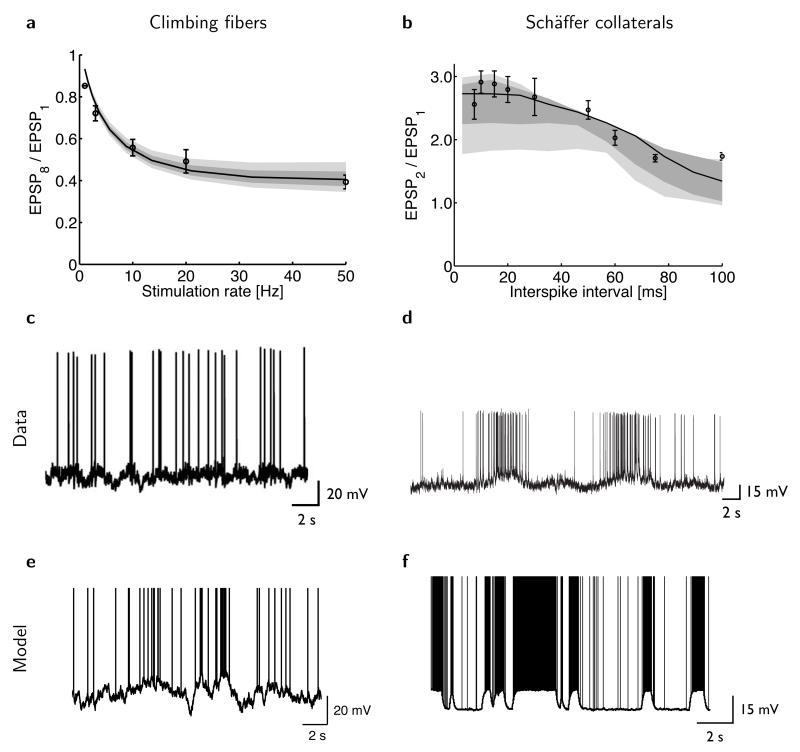
Figure 3.
The optimal estimator reproduces experimentally observed patterns of synaptic depression and facilitation. (a) Synaptic depression in cerebellar climbing fibers (circles: mean ± s.e.m.; redrawn from ref. 6) and in the model (solid line), measured as the ratio of the amplitude of the eighth and first EPSP as a function of the stimulation rate during a train of eight presynaptic spikes. (b) Synaptic facilitation in hippocampal Schäffer collaterals (circles, mean ± s.e.m.; redrawn from ref. 39) and in the model (solid line), measured as the ratio of the amplitude of the second and first EPSP as a function of the interval between a pair of presynaptic spikes. Shading in a and b shows the robustness of the fits (Online Methods): model predictions when best-fit parameters are perturbed by 5% (dark gray) or 10% (light gray). (c–d) Predictions of the model for the dynamics of inferior olive neurons (c) and hippocampal pyramidal neurons (d). Sample traces were generated with parameters fitted to the data about STP in cerebellar climbing fibers (shown in a) and Schäffer collaterals (shown in b). (e–f) In vivo intracellular recordings from inferior olive neurons of the (anesthetized) rat (e, reproduced from ref. 40) and hippocampal pyramidal cells of the behaving rat (f, reproduced from ref. 38).

