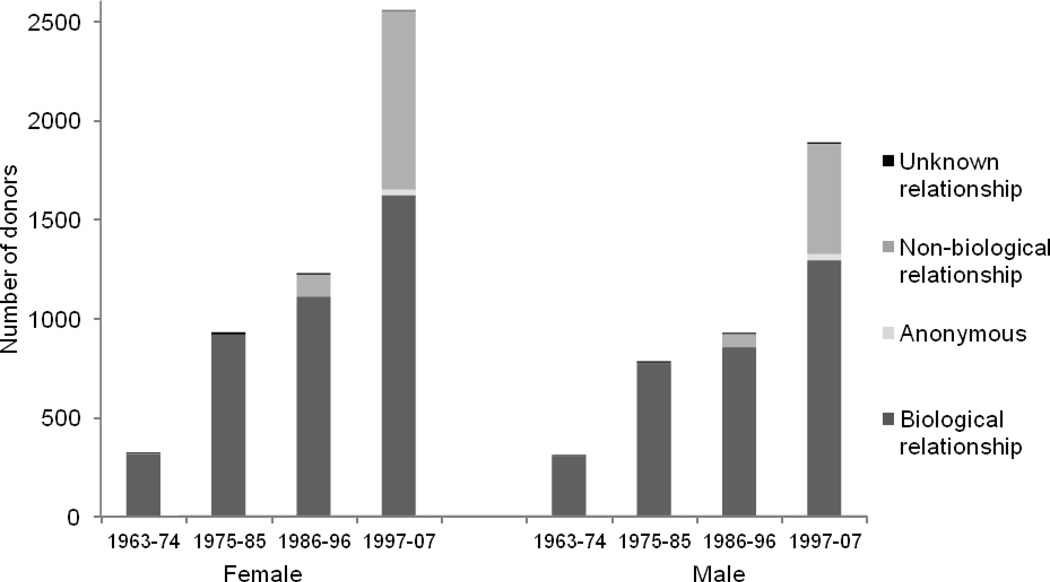
Figure 1. Total number of donors and relationship of donor to recipient by sex.
The number of living donors increased substantially, from quartile 1 to quartile 4. There was a trend on both an absolute and percent basis for more female donors in recent years. There was a notable increase in the percentage of non-biologically related donors in the 1997–2007 quartile.

