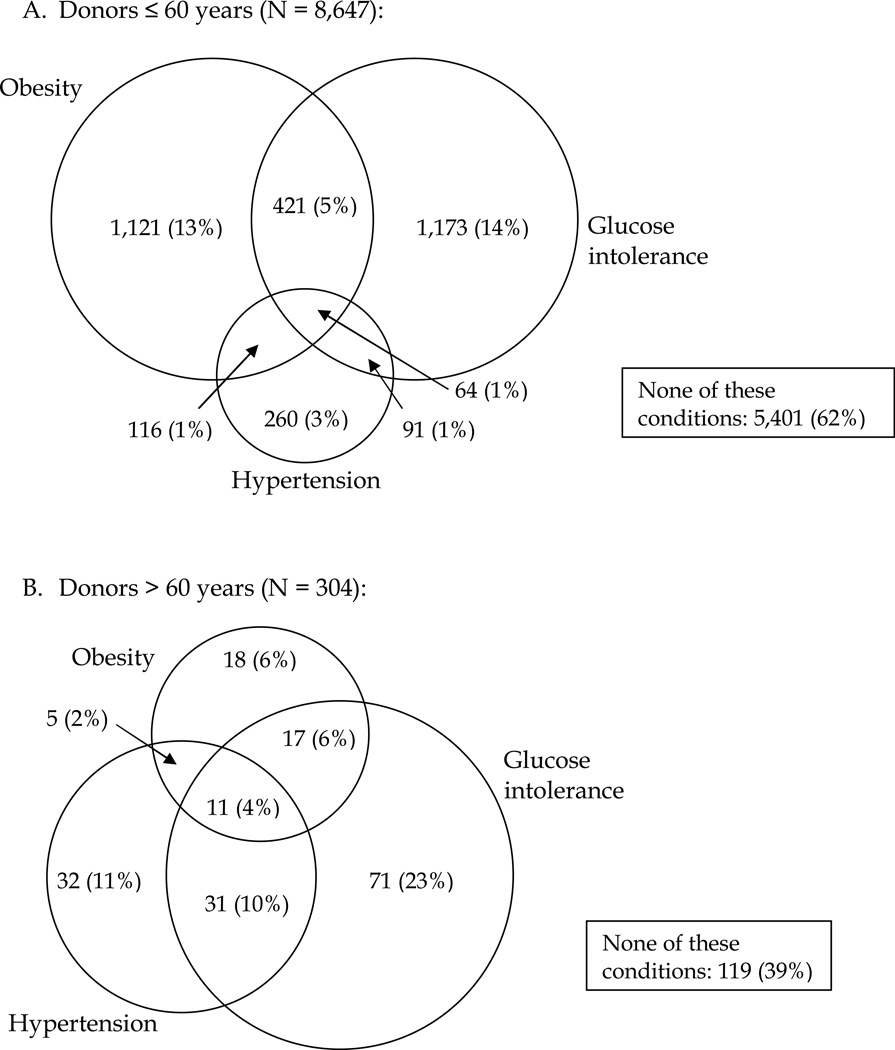
Figure 3. Clustering of obesity, glucose intolerance, and hypertension*.
Donors are categorized into groups based on pre-donation BMI ≥ 30 kg/m2, fasting blood glucose > 100 mg/dL, and diagnosis of hypertension using Venn diagrams and compared by age (younger ≤60 years old and older >60 years old) using the chi-square test.
* The overall Chi-square statistic is significant (χ2 = 318.2, p < 0.0001), indicating the clustering of obesity, glucose intolerance, and hypertension differs by age category.

