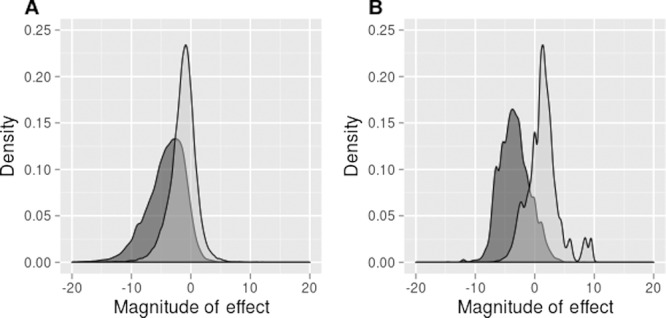
Figure 1.

The distribution of the predicted magnitude of effect for disease-associated (shaded region) and functionally neutral (unshaded region) AASs in the SwissVar dataset using our unweighted and weighted methods (A and B, respectively). From this, we calculated prediction thresholds at which both specificity and sensitivity were maximized (−3.0 and −1.5, respectively).
