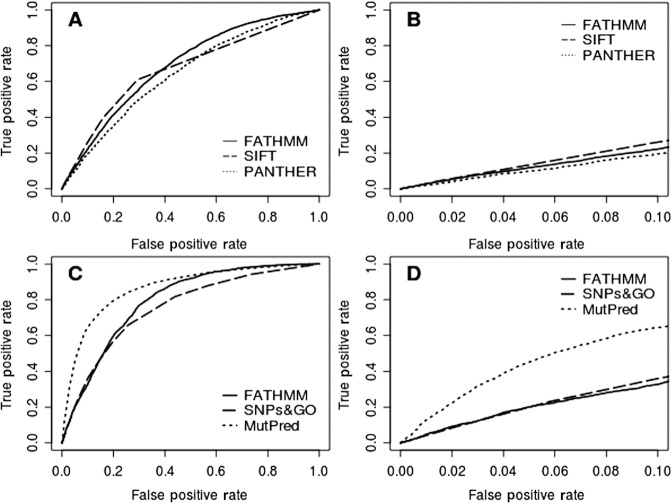
Figure 2.
Receiver operating characteristic (ROC) curves for the top-ranking computational prediction algorithms evaluated using the SwissVar dataset. Here, we compare our unweighted method against SIFT and PANTHER (A—full curve; B—10% false positive rate) whereas our weighted method is compared to SNPs&GO and MutPred (C—full curve; D—10% false positive rate). Full ROC curves for all computational prediction algorithms evaluated are made available in Supp. Figure S3.

