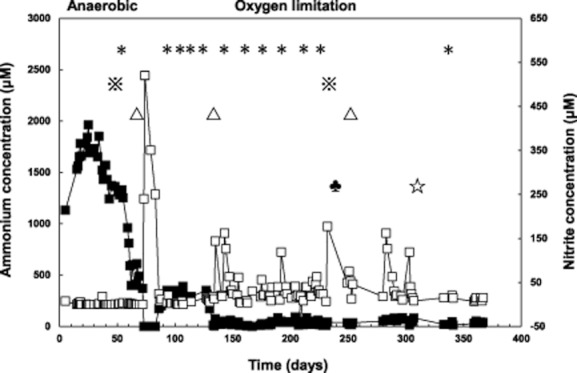
Fig 1.

Concentrations of ammonium (▪) and nitrite (□) in the effluent of the bioreactor throughout the entire operational period. The asterisks (∗) indicate when biomass was harvested for genomic DNA isolation followed by PCR or qPCR analyses. The white triangles (▵) indicate when potential activity assays for each functional group were performed. The reference marks ( ) indicate when biomass was harvested for RNA isolation, and clubs (♣) and white stars (☆) indicate when biomass was harvested for TEM and lipid analyses respectively.
