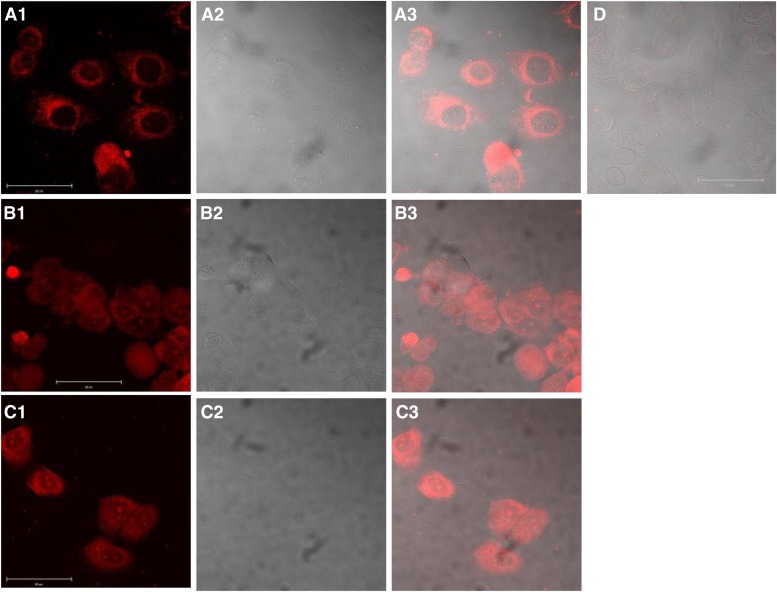
Fig. 2.
Cell uptake study of BMSG-SH-3–5 in the breast cancer cell line MCF7. (A1) BMSG-SH-3, 50 μM, 30 min, fluorescence image. (A2) Transmitted light image. (A3) Merge of images A1 and A2. (B1) BMSG-SH-4, 500 nM, 30 min, fluorescence image. (B2) Transmitted light image. (B3) Merge of images B1 and B2. (C1) BMSG-SH-5, 500 nM, 30 min, fluorescence image. (C2) Transmitted light image. (C3) Merge of images C1 and C2. (D) Untreated sample, merge of fluorescence and transmitted light image. Scale: 50 μm.

