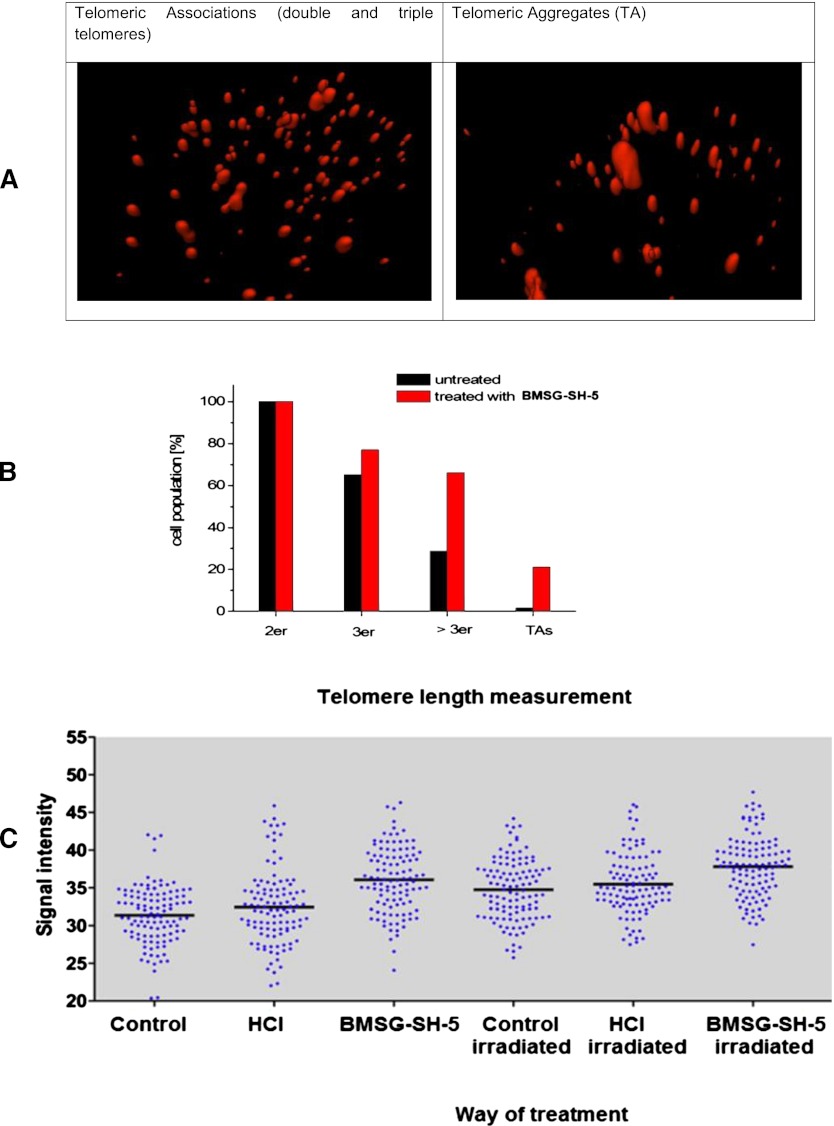
Fig. 7.
(A) Pictures of single cells: 3D fluorescence in situ hybridization of HaCaT-myc cells applying a CY3 (red) labeled telomere-specific PNA probe (left: cell showing double and triple telomeres; right: cell showing a telomeric aggregate). (B) Telomere association (2er, 3er, > 3er) and telomere aggregates (TAs) in HaCaT-myc cells incubated with BMSG-SH-5 (40 nM, 48 h). (C) Representation of the telomeric signal intensity as a measure for telomere length. Each set of blue dots represents the median telomere length within a single cell; the black bar indicates the mean telomere length within each data set. Here, the ligand concentration was 40 nM, and the cells were irradiated with 5 J/m2 UV-C.

