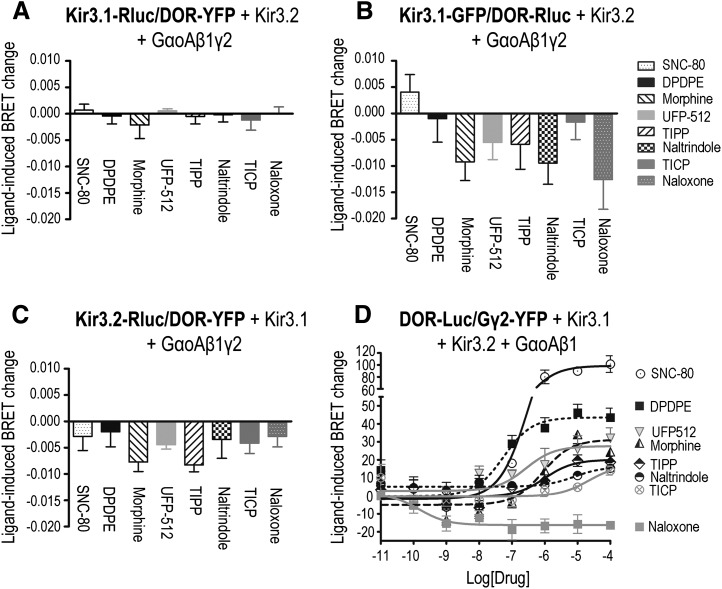
Fig. 3.
DOR stimulation did not modify receptor interaction with Kir3.1/3.2 channel subunits but induced conformational rearrangements between receptor and the Gβ1γ2 dimer. HEK293 cells were transfected with the indicated BRET pairs together with untagged signaling partners to assess DOR interaction with Kir3 (A–C) or Gγ2 (D) subunits. (A–C) BRET measures were obtained in the presence or absence of indicated DOR ligands (10 µM; 2 min), and results were expressed as the difference between these readings, corresponding to mean ± S.E.M. of three to seven independent experiments. Statistical comparisons for each BRET pair were carried out on net BRET values using repeated measures one-way analysis of variance, followed by Bonferroni posthoc test for multiple comparisons. * P < 0.05 indicates significance compared with untreated controls. Spontaneous net BRET for the Kir3.1-Rluc/DOR-YFP pair: 0.042 ± 0.002 (n = 3). Spontaneous net BRET for the DOR-Rluc/Kir3.1-GFP (green fluorescent protein) pair: 0.032 ± 0.002 (n = 5). Spontaneous net BRET for the Kir3.2-Rluc/DOR-YFP pair: 0.087 ± 0.003 (n = 7). (D) Drug ability to modify DOR-Luc/YFP-Rluc interaction was assessed in dose-response curves. Results were normalized to the maximal effect observed for SNC-80 and correspond to mean ± S.E.M. of four experiments. Curves were compared by two-way analysis of variance (ANOVA), which revealed an effect of drug (P < 0.0001) and concentration (P < 0.0001) as well as an interaction (P < 0.0001). Subsequent comparison by simultaneous curve fitting yielded the rank order of Emax values detailed in the text. Spontaneous net BRET for the DOR-Luc/YFP-Rluc pair: 0.106 ± 0.013 (n = 4).

