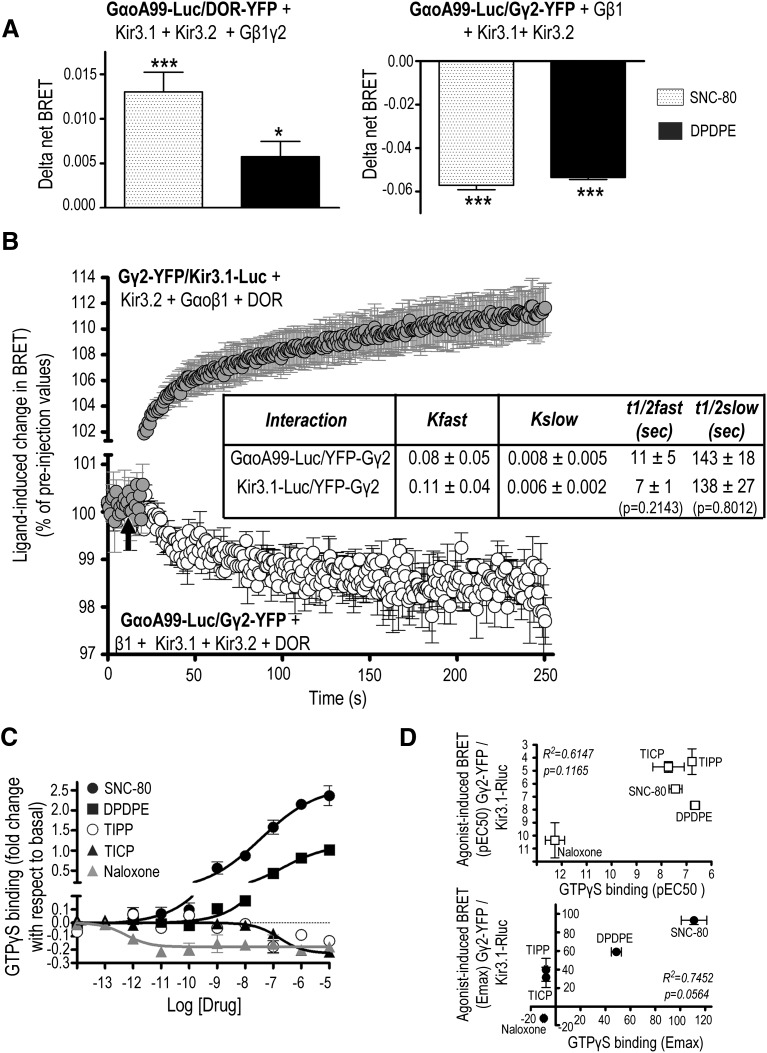
Fig. 6.
DOR-induced conformational changes between Gβγ and Kir3.1 channel subunits are associated with conformational rearrangements among GαoA/Gβγ subunits. (A) HEK293 cells were transfected with the indicated BRET pairs and untagged signaling partners to evaluate GαοA interaction with DOR and the Gβγ dimer. BRET measures were taken in the presence or absence of DPDPE or SNC-80 (10 µM; 2 min). Results were expressed as the difference between measures obtained in presence and the absence of ligand and correspond to mean ± S.E.M. of five experiments. Statistical comparisons for each BRET pair were carried out on net BRET values using repeated measures one-way ANOVA, followed by Dunnett posthoc test. * P < 0.05; *** P < 0.001 compared with untreated controls. (B) HEK293 cells were transfected as indicated, and BRET kinetics were obtained at room temperature using a Mitras plate reader with automatic injector. SNC-80 injection is indicated by a black arrow. Data are expressed as percent of preinjection values and correspond to mean ± S.E.M. of three experiments. Slow and fast t1/2 values for each interaction were compared by non-paired t test and appear in the inset. (C) HEK293 cells stably expressing Flag-DOR were exposed to the indicated ligands to determine [35S]GTPγS binding. Results are expressed as fold of change with respect to basal binding and correspond to mean ± S.E.M. of two or three experiments carried out in triplicate (naloxone n = 2; rest n = 3). Curves were compared by two-way ANOVA, revealing an effect of drug (P < 0.0001) and concentration (P < 0.0001) as well as an interaction (P < 0.0001). (D) Correlation of EC50 (above) and Emax (below) values for ligand-induced GTPγS binding and BRET changes at the pairs assessing Gβγ interaction with Kir3.1 subunits (Kir3.1-Luc/Gγ2-YFP).

