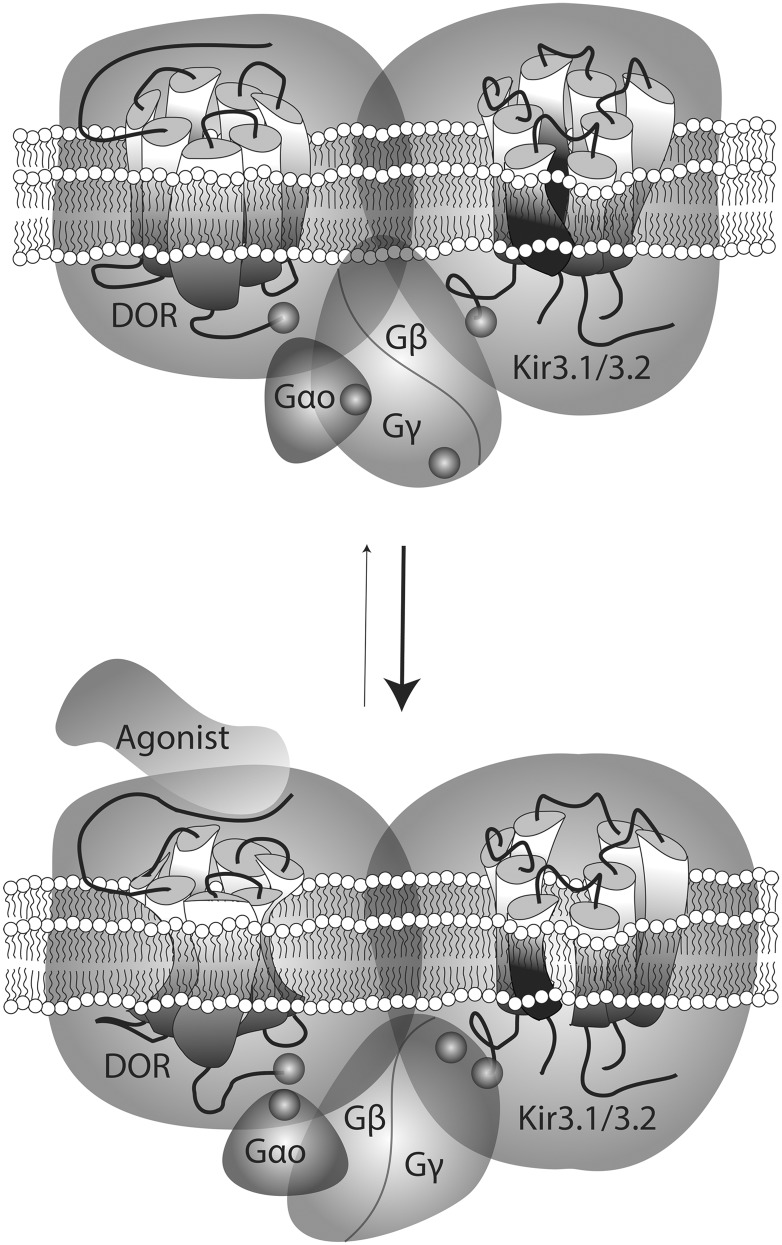
Fig. 9.
Schematic representation of conformational rearrangements undergone by different complex components on DOR activation by an agonist. Biosensors assessing interactions between DORs, GαoAβ1γ2, and Kir3.1/3.2 subunits revealed the spontaneous association of these proteins within a multimeric array. In the nonstimulated complex, the receptor C-terminus was within a distance of 100 Å of the C-terminal end of Kir3 subunits, the N-terminus of Gγ2, and position 99 in the αA-αB loop of GαoA subunits. On stimulation by an agonist, DORs and Kir3 C-termini underwent minimal displacement with respect to one another, but the tag at the N-terminal domain of Gγ2 approached these two regions. This rearrangement was paralelled by Gγ2 separation from the helical domain of GαoA which, in turn, moved closer to the C-terminal tag on the receptor. No basal or ligand induced transfer of energy was observed at the BRET pair assessing GαoA and Kir3.1 interaction.

