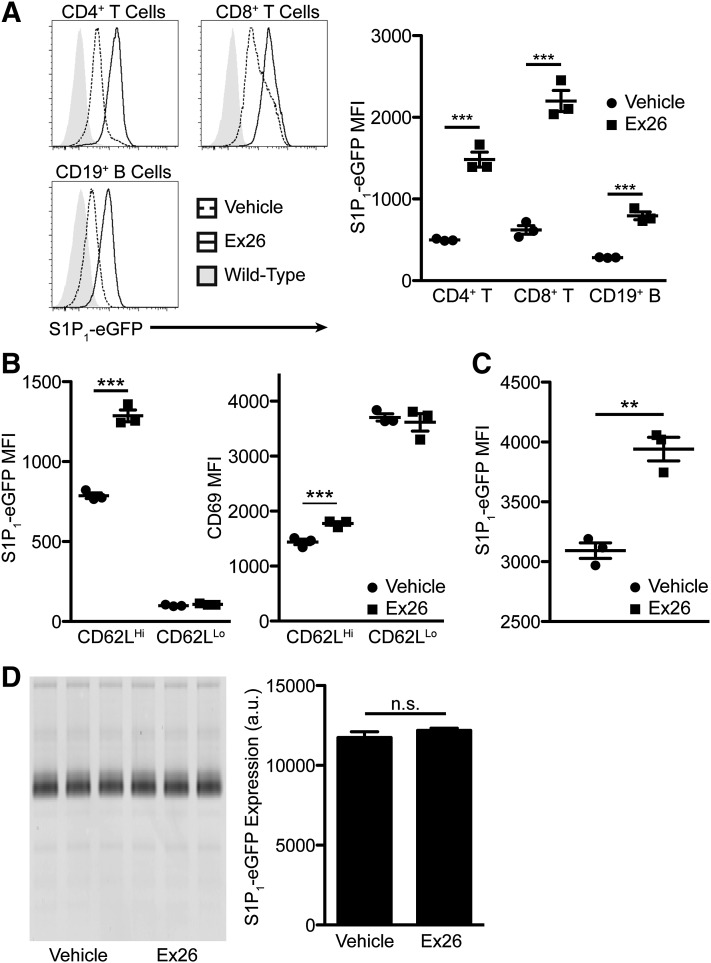
Fig. 3.
S1P1 antagonism by Ex26 upregulates S1P1 and CD69, but not in the central nervous system. (A) S1P1-eGFP expression on lymphocytes from lymph nodes from S1P1-eGFP knockin mice continuously administered Ex26 by micro-osmotic pump for 3 days. Gray shaded histograms represent background fluorescence in wild-type mice. The graph on the right represents the mean fluorescence intensity of S1P1-eGFP on the indicated cell type. (B) Mean fluorescence intensity of S1P1-eGFP (left) and CD69 (right) on CD4 SP thymocytes following continuous treatment with Ex26. (C) Mean fluorescence intensity of S1P1-eGFP on lung endothelial cells following continuous treatment with Ex26. (D) Fluorescent scan of SDS-PAGE gel from the brains of mice following 3 days of treatment with Ex26. The graph on the right is obtained by densitometric analysis of the gel on the left. All histograms and graphs are representative of three experiments, with 3–4 mice per group per experiment. Graphs are plotted as the mean ± S.E.M. **P < 0.01, ***P < 0.001 as determined by an unpaired, two-tailed t test. a.u., arbitrary units; MFI, mean fluorescence intensity; n.s., not significant.

