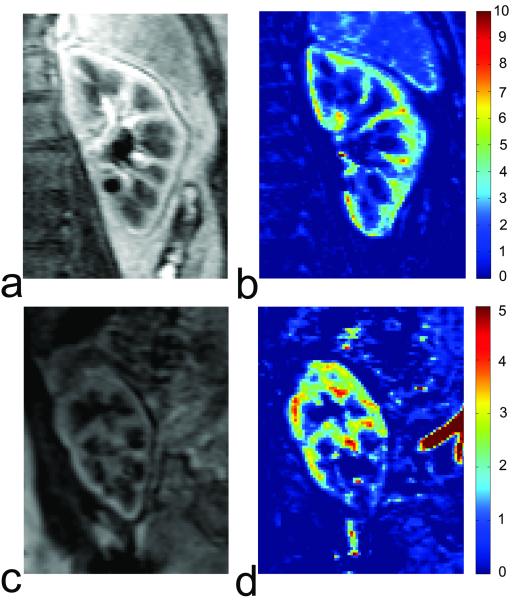
Figure 3.
Comparison of DCE MRI for a healthy kidney and a partially ischemic transplant. (a) One image of the healthy kidney from post-contrast vascular phase; (b) the perfusion map of the healthy kidney generated from vascular-phase images; (c) one image of the renal transplant from post-contrast vascular phase; (d) the perfusion map of the transplant showing partial ischemia.

