
Figure 7.
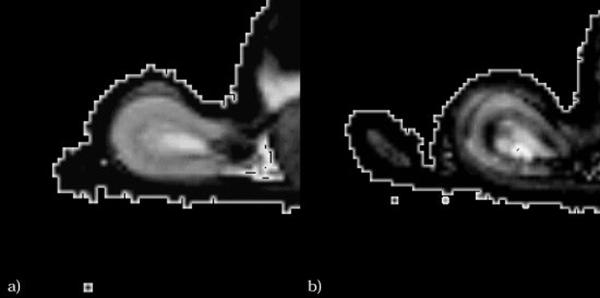
T2* maps of (a) healthy and (b) diabetic kidneys for comparison. In both cases, the lowest T2* values clearly are found within the outer stripe of the outer medulla. Note that low T2* value corresponds to low oxygenation. Reprinted with permission from John Willy and Sons (82).