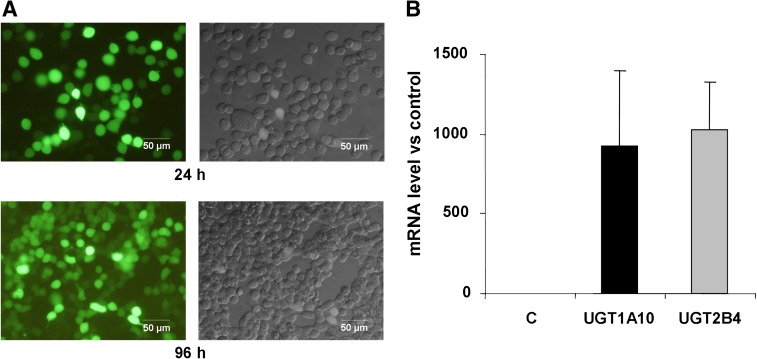
Fig. 2.
Efficiency of transfection. (A) KB-3 cells were transiently transfected with a plasmid encoding GFP and viewed after 24 h or 96 h by fluorescence (left panels) or differential interference contrast (right panels) microscopy, as described under Materials and Methods. The bar indicates 50 μm. (B) mRNA levels of UGTs after transfection. KB-3 cells were transiently transfected with plasmids encoding UGT1A10 or UGT2B4 and after 24 h mRNA was isolated and subjected to real-time quantitative PCR analysis, as described under Materials and Methods. Levels are expressed relative to the control gene GAPDH and represent mean ± S.D., n = 4. (C) mRNA isolated from control untransfected cells.

