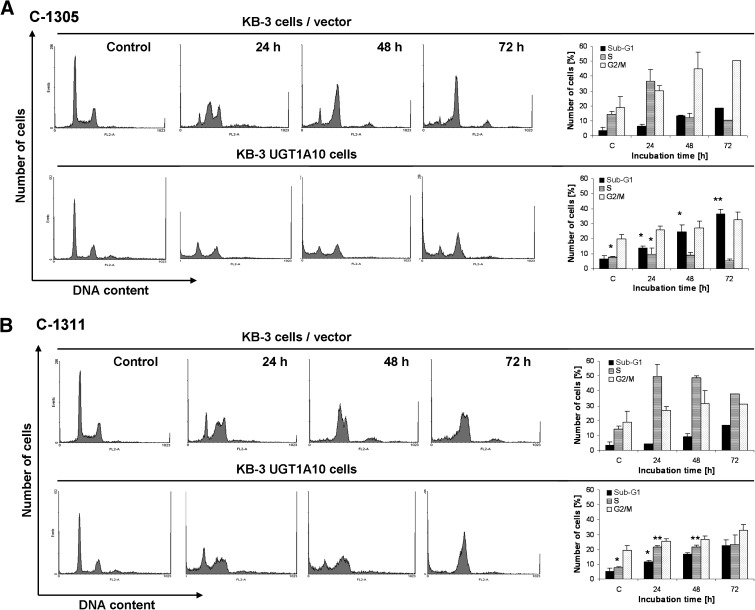
Fig. 6.
Cell-cycle distribution. Vector-transfected KB-3 cells or KB-3 cells transiently transfected for 24 hours with UGT1A10 were untreated (control) or treated with 8 μM C-1305 (A) or 3 μM C-1311 (B) for the times indicated and subjected to propidium iodide staining and flow cytometry as described under Methods and Materials. The histograms show the number of cells (y-axis) versus DNA content (x-axis) and are representative of at least two experiments for each condition. Bar graphs on the right show data quantitation with the percentage of cells with sub-G1, S, or G2/M DNA content as indicated. Significant differences in the cell percentages between vector-transfected and UGT1A10-transfected are indicated as follows: *P ≤ 0.05; **P ≤ 0.01.

