Fig. 3.
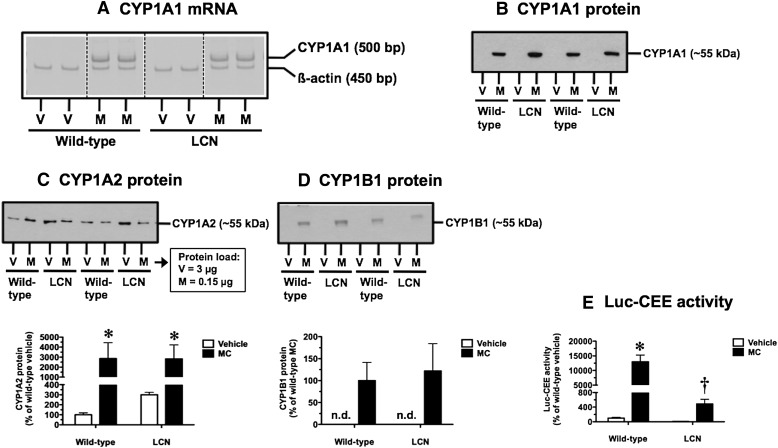
Effect of MC treatment on hepatic CYP1A1 mRNA (A), CYP1A1 protein (B), CYP1A2 protein (C), CYP1B1 protein (D), and CYP1A1-mediated Luc-CEE catalytic activity (E) in wild-type and LCN mice. (A) Reverse-transcription polymerase chain reaction analysis of CYP1A1 and β-actin mRNA levels as visualized on Vistra Green–stained polyacrylamide gels, showing results for two vehicle (V)- and MC (M)-treated mice per genotype. Immunoblot of microsomal protein (CYP1A1: 5 µg; CYP1A2: 3 µg for V and 0.15 µg for M; CYP1B1: 5 µg) using monoclonal antibody against rat CYP1A1 (B), monoclonal antibody against rat CYP1A2 (C), and polyclonal antibody against human CYP1B1 (D), showing results for two V- and M-treated mice per genotype. Quantitative analysis of CYP1A2 protein levels (C) and Luc-CEE activity (E). Data represent the mean ± S.D. of determinations from four mice per group, expressed as a percentage of the mean for the vehicle-treated wild-type mice. The P values for the two-way ANOVA main effects were P = 0.0003 (treatment), P = 0.8699 (genotype), and P = 0.8342 (interaction) for CYP1A2 protein, and P < 0.0001 (treatment), P < 0.0001 (genotype), and P < 0.0001 (interaction) for Luc-CEE activity. Post-test outcomes were as follows: *significantly different (P < 0.05) from genotype-matched vehicle-control mice; †significantly different (P < 0.05) from treatment-matched wild-type mice. (D) Quantitative analysis of CYP1B1 protein levels. Data represent the mean ± S.D. of determinations from four mice per group, expressed as a percentage of the mean for the MC-treated wild-type mice. bp, base pair; n.d., not detectable.

